ENGR 21 Fall 2025
HW 5 Solutions
(1) Complete in-class activity: Numpy functions
For each of the functions from the numpy package named below, write a line or set of lines of code that demonstrates how this function is used. You must also write a plain-language comment before demonstrating each function, and in this comment you should write what that function does.
The list of functions is:
numpy.array()
numpy.zeros()
numpy.ones()
numpy.empty()
numpy.arange()
numpy.linspace()
numpy.random.rand()
numpy.random.randint()
numpy.reshape()
numpy.transpose()
numpy.concatenate()
numpy.flatten()
numpy.resize()
numpy.shape()
numpy.savetxt()
numpy.loadtxt()
Note: The function flatten cannot actually be used directly using numpy.flatten as written above, which was an oversight on the part of the isntructor. It is a method associated with the class ndarray, and you can see how to use it on the manual page.
The solutions below have been taken from a student’s submission.
import numpy as np

# numpy.array() creates an array from a python list or tuple
npArray = np.array([1,2,3,4,5,6])
print(f"npArray: {npArray}")

#numpy.zeros() creates an array filled with zeros
npZeros = np.zeros((2,2))
print(f"npZeros: {npZeros}")

#numpy.ones() creates an array filled with ones
npOnes = np.ones((2,2))
print(f"npOnes: {npOnes}")

# numpy.empty() creates an array without initializing any internal values
npEmpty = np.empty((2,2))
print(f"npEmpty: {npEmpty}")    #values are random in memory

# numpy.arange() creates an array with values evenly spaced based on a specified range
npArange = np.arange(0, 12, 3)
print(f"npArrange: {npArange}")

# numpy.linspace() creates an array with values evenly spaced betwen a start and end inclusive
npLinspace = np.linspace(0, 12, 3)
print(f"npLinspace: {npLinspace}")

# numpy.random.rand() creates an array with random numbers between 0 and 1
npRand = np.random.rand(2,2)
print(f"npRand: {npRand}")

# numpy.random.randint() creates an array filled with random numbers within a certain range
npRandint = np.random.randint(0, 4, size = (2,2))
print(f"npRandint: {npRandint}")

# numpy.reshape() alters the shape of an array without changing the data
npReshape = npRandint.reshape(1,4)
print(f"npReshape on npRandint: {npReshape}")

# numpy.transpose() switches the rows and columns of an array
npTranspose = npReshape.transpose()
print(f"npTranspose on npReshape: {npTranspose}")

# numpy.concatenate() joins two arrays together along the preexisting axis
npConcatenate = np.concatenate((npZeros, npOnes))
print(f"npConcatenate with npZeros and npOnes: {npConcatenate}")

# numpy.flatten() alters an array from multiple dimensions to one dimension
npFlatten = npConcatenate.flatten()
print(f"npFlatten on npConcatenate: {npFlatten}")

# numpy.resize() returns a new array with a specified shape
npResize = np.resize(npZeros, (3,3))
print(f"npResize npZeros to 3x3: {npResize}")

# numpy.shape() returns the dimensions of an array
npShape = np.shape(npResize)
print(f"npShape of npResize: {npShape}")

# numpy.savetxt() saves an array to a txt file
np.savetxt("test.txt", npResize)

# numpy.loadtxt() loads data from a text file to an array
npLoadtxt = np.loadtxt("test.txt")
print(f"npLoadtxt from test.txt: {npLoadtxt}")
(2) Working with Numpy arrays: Iteration
For each task below, you should create a function that takes as input an arbitrarily-sized 2D array. The functions need not return anything. The functions should be named as func2_1(...), func2_2(...), func2_3(...), where the number after func2_ denotes the part number in the following list.
You may wish to test out your code on arrays of arbitrary size. Initialize random arrays of specified size using the syntax
numpy.random.randint(1,10,size=(7,10))
This will create a $7 \times 10$ array of integers between 1 and 10.
- The
numpy.arraytype is iterable, just likelists andtuples are. Use this fact to write aforloop that iterates over the array that you created and prints all the rows.a = np.random.randint(1,10,size=(7,10)) for i in a: print(i) - The function
numpy.nditercreates a different type of iterable when applied to an object of typenumpy.array. Use this fact to write aforloop that iterates overnumpy.nditer(your array), and prints all the elements.c = np.nditer(a) for j in c: print(j) - It is also possible to iterate over
numpyarrays using the familiarfor x in range(n)technique. Use a nestedforloop (i.e., a total of two loops, one inside the other) to print every element in the array. It should first print out all the elements of the first row, starting from the first column (i.e., starting from the left), then all the elements of the second row, and so on.for j in range(len(a[0,:])): for i in range(len(a[:,0])): print(a[i,j]) - Repeat 3, but this time, your function should print out the first column first, starting from the top; then it should move to the next column, and so on.
for j in range(len(a[:,0])):
 for i in range(len(a[0,:])):
     print(a[j,i])
Note that there are a few different ways to accomplish tasks 3 and 4 above. Other answers are acceptable, too.
(3) Working with Numpy arrays: Manipulating arrays
For this problem, please name your functions func3_1, func3_2, and func3_3.
-
Write a function that reverses the order of rows in a
numpyarray. The function should take an arbitarily-sized 2D array and return a 2D array of the same size. -
Write a function that reverses the order of columns in a
numpyarray. The function should take an arbitrarily-sized 2D array and return a 2D array of the same size. -
Write a function that takes as input argument a square 2D array, i.e. with shape
(n,n)and returns as output a 1-dimensionalnumpyarray of lengthncontaining the diagonal elements of the 2D array.
The solutions are given below.
def func3_1(a):
    b = np.zeros(np.shape(a),dtype=np.int64)
    n_rows, n_columns = np.shape(a)
    for k in range(n_rows):
        b[len(a)-k-1] = a[k]
    return b

def func3_2(a):
    b = np.zeros(np.shape(a),dtype=np.int64)
    n_rows, n_columns = np.shape(a)
    for k in range(n_columns):
        b[:,n_columns-k-1] = a[:,k]
    return b

def func3_3(a):
    nr,nc = np.shape(a)
    if nr != nc:
        raise Exception("Sorry, must provide a square array")
    else:
        # Pre-allocate
        b = np.zeros(nr)
        for j in range(nr):
            b[j] = a[j,j]
        return b
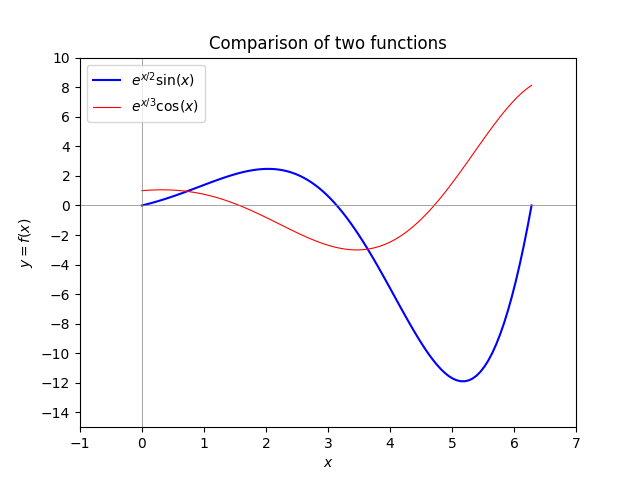
(4) Plotting
Plotting Mathematical functions in matplotlib
import numpy as np
import matplotlib.pyplot as plt

plt.clf()
x = np.linspace(0,2*np.pi,100)
y1 = np.exp(x/2)*np.sin(x)
y2 = np.exp(x/3)*np.cos(x)

plt.plot(x,y1,label='$e^{x/2} \sin(x)$',linewidth=1.5,color='blue')
plt.plot(x,y2,label='$e^{x/3} \cos(x)$',linewidth=0.8,color='red')

plt.axhline(color='gray',linewidth=0.5)
plt.axvline(color='gray',linewidth=0.5)

plt.legend(loc='upper left')

plt.xlim([-1,7])
plt.ylim([-15,10])

plt.yticks(range(-14,12,2))

plt.title('Comparison of two functions')

plt.xlabel('$x$')
plt.ylabel('$y = f(x)$')
plt.savefig('example1.png')
plt.show()
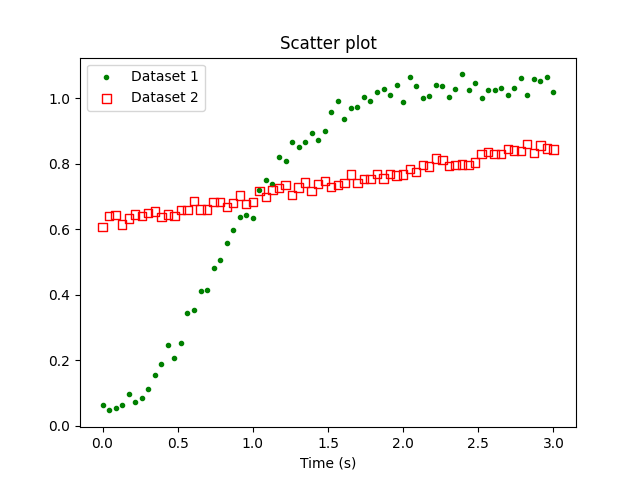
Plotting numerical data using matplotlib
import numpy as np
import matplotlib.pyplot as plt

data = np.loadtxt('HW5_prob4_data.csv',delimiter=',')

x1 = data[:,0]
y1 = data[:,1]
x2 = data[:,2]
y2 = data[:,3]

plt.scatter(x1,y1,marker=".",color='green')
plt.scatter(x2,y2,marker="s",facecolor='none',edgecolor='red')

plt.legend(['Dataset 1','Dataset 2'],loc='upper left')

plt.title('Scatter plot')
plt.xlabel('Time (s)')

plt.savefig('example2.png')