Lab 2: Stress-Strain Curves for Engineering Metals
Typical stress-strain curves for ductile metals
Typical metals have a stress-strain curve that looks like this:
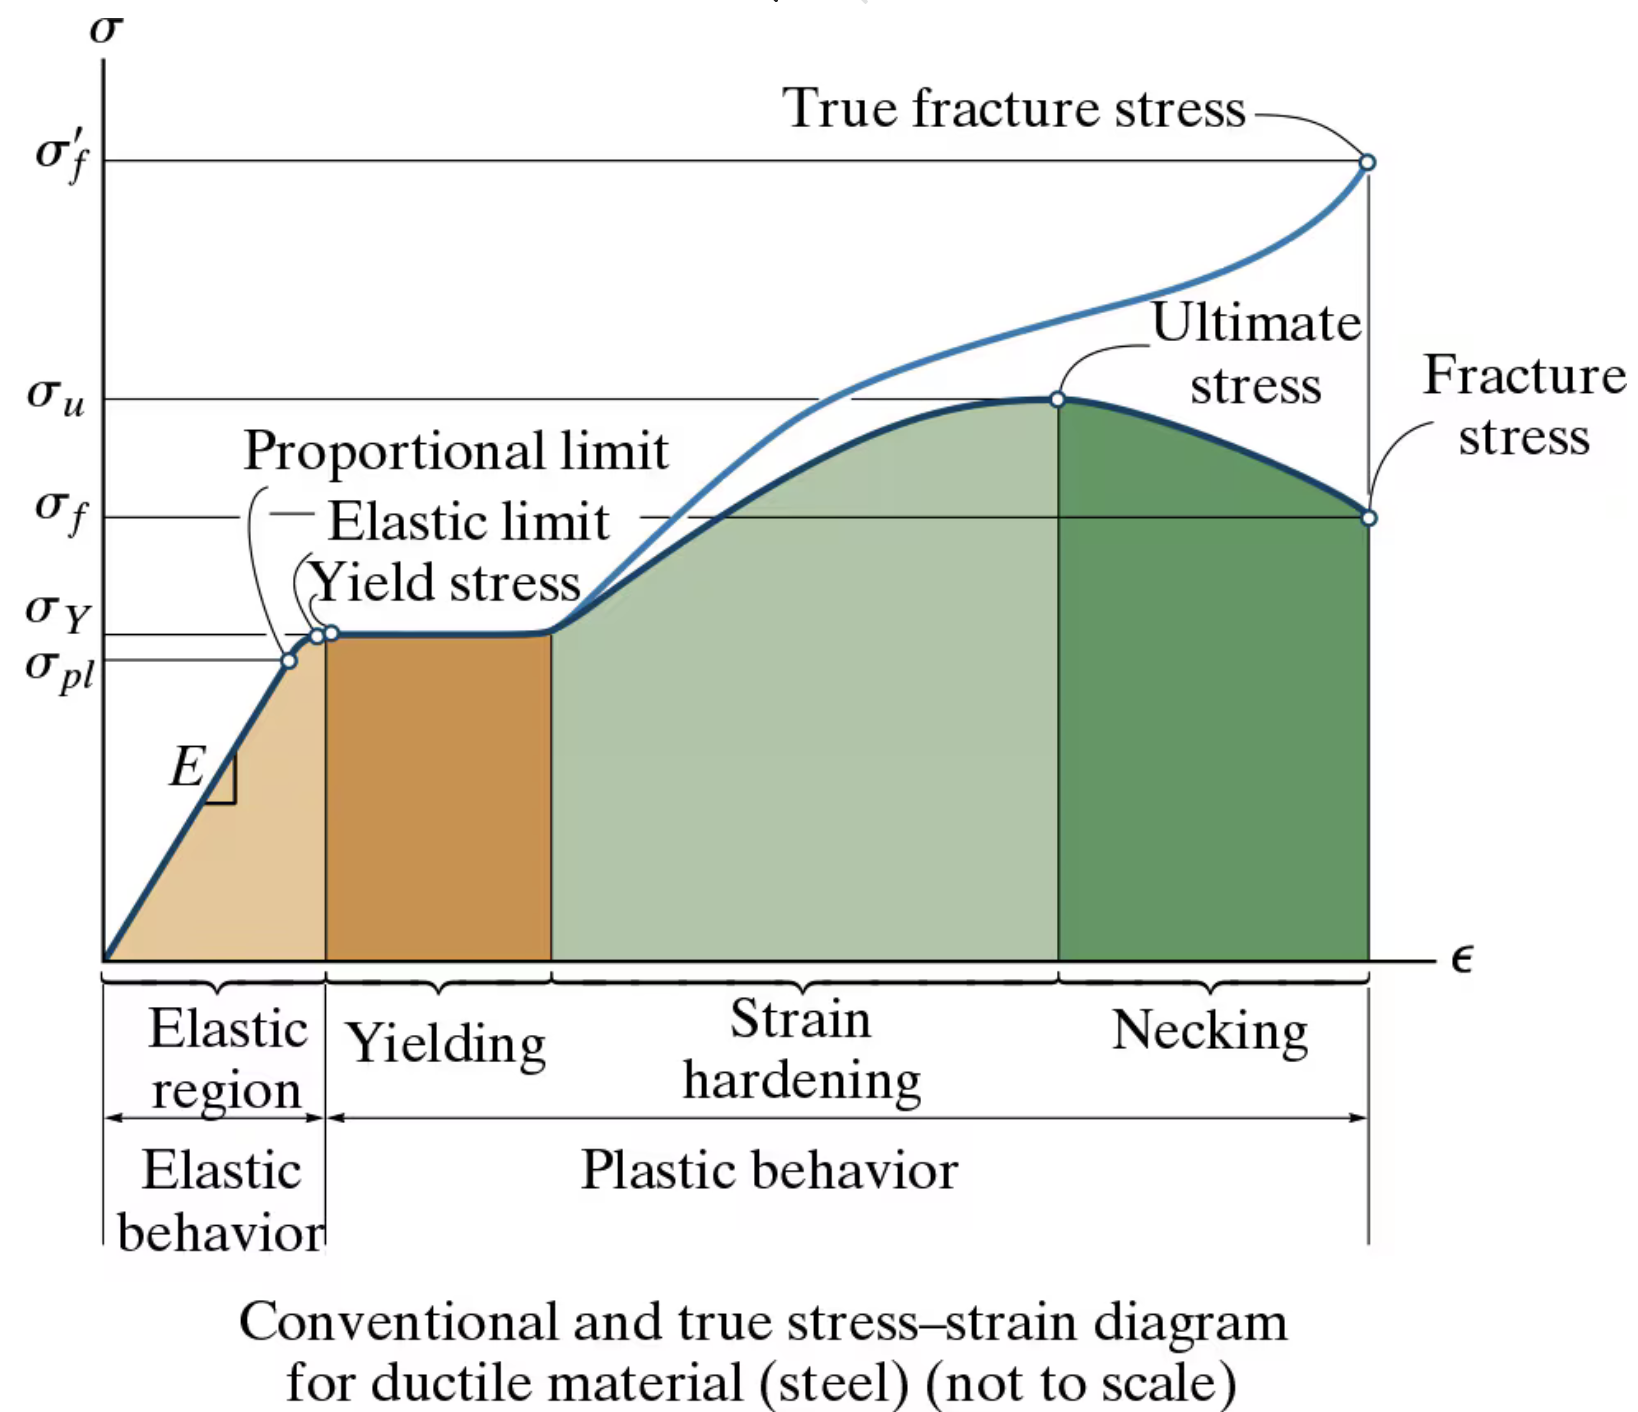
Another way to visualize stress-strain diagrams for metals is to use two different scales on the horizontal axis, as shown in Figure 1.
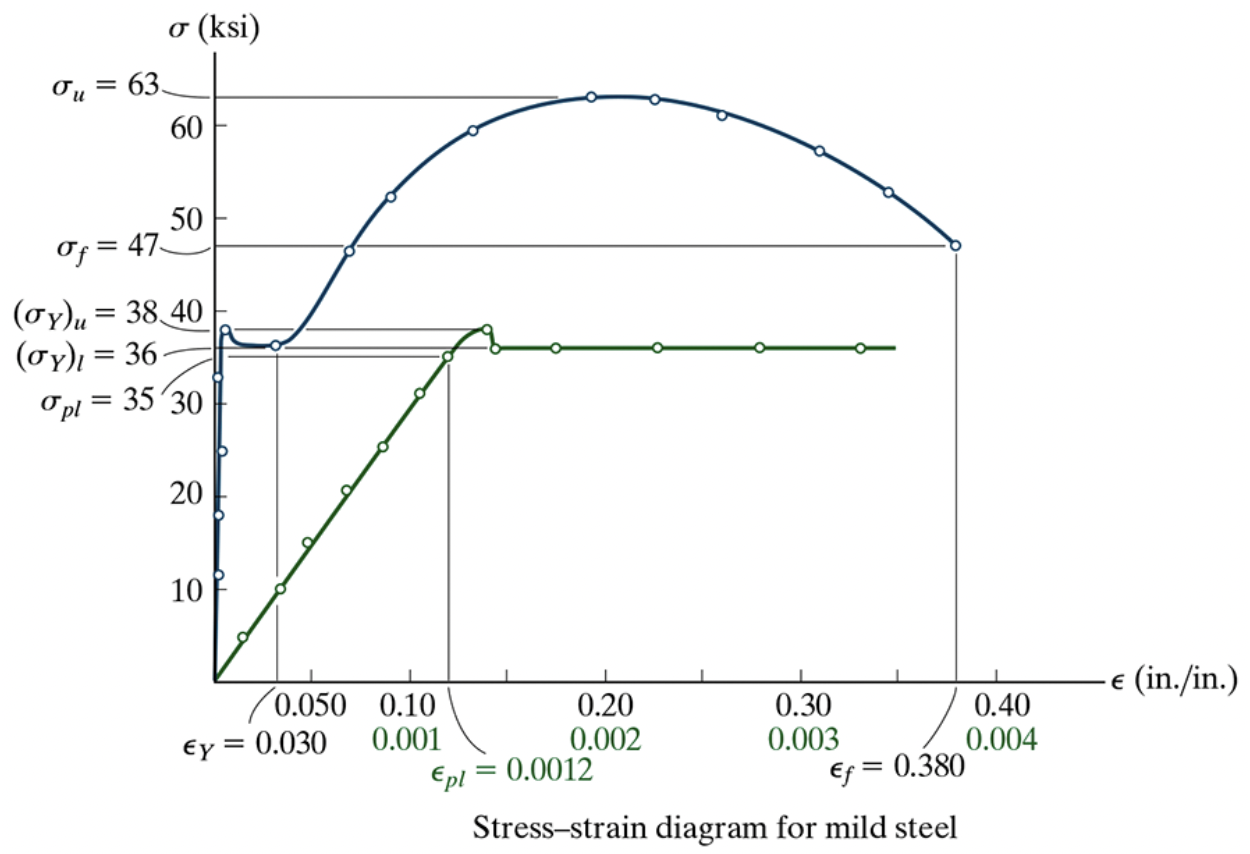
The 0.2% Offset Method
In order to decide when a metal has yielded, engineers use a rule called the 0.2% offset method. This rule states that a material can be said to have yielded under a load \(\sigma_Y\) when, after loading from \(\sigma = 0\) to \(\sigma = \sigma_Y\) and subsequently unloading to \(\sigma =0\), there is a residual strain of \(0.2 \%\) or \(0.002\).
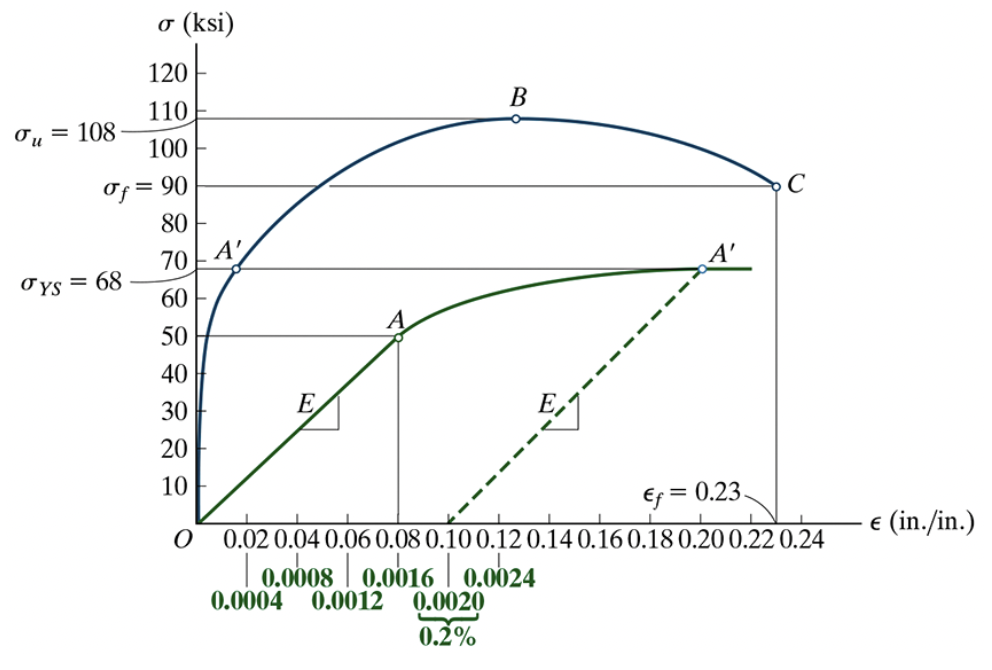
Figure 2: The 0.2% offset method graphically representend
It can be calculated by drawing a straight line parallel to the linear portion of the stress-strain curve, from a point on the nonlinear portion down to the strain axis. The line should intersect the strain axis at \(0.2 \%\); the intersection of this line with the stress-strain curve — point A’ above — is the yield point as determined by the \(0.2 \%\) method. This is illustrated in Figure 2.
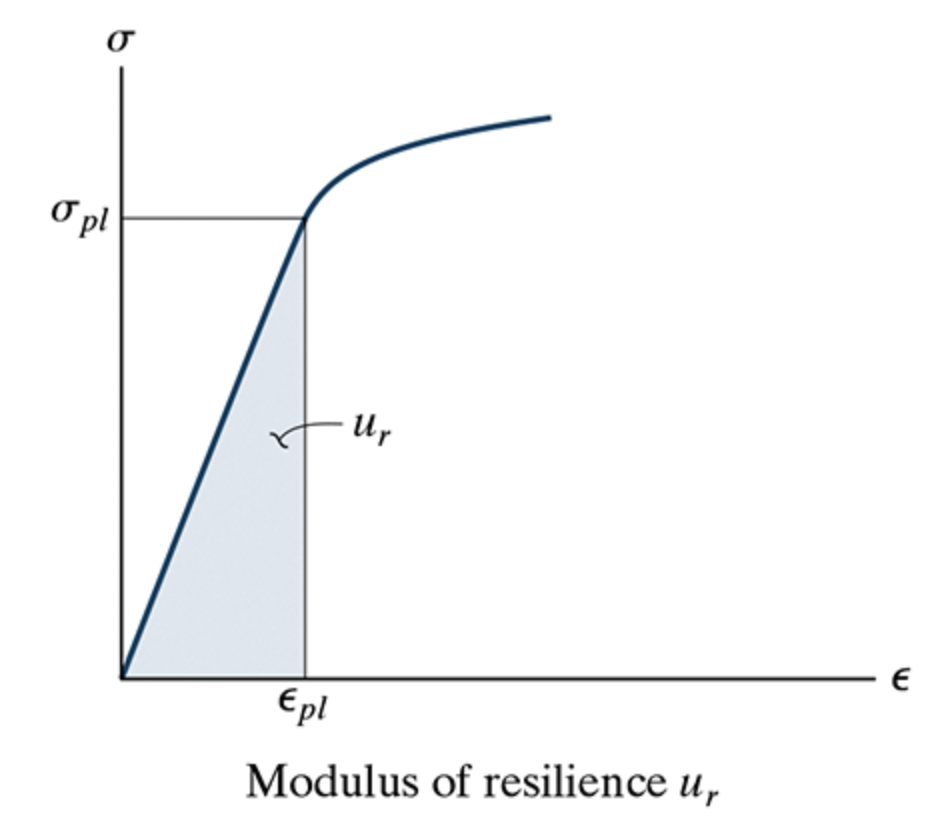
Modulus of Resilience
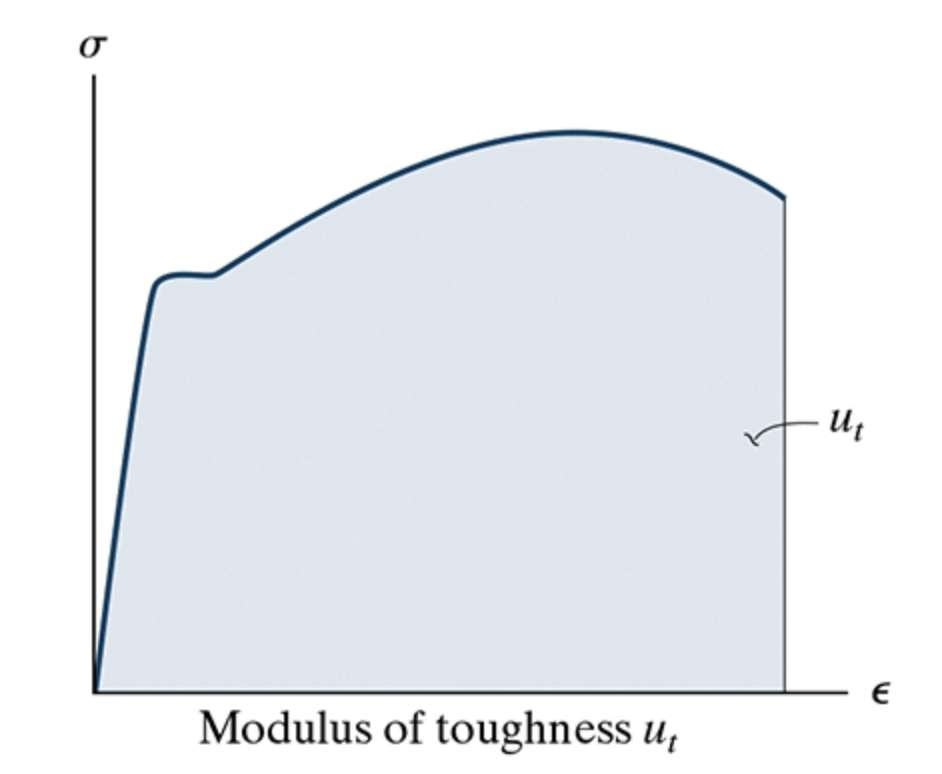
Modulus of Toughness
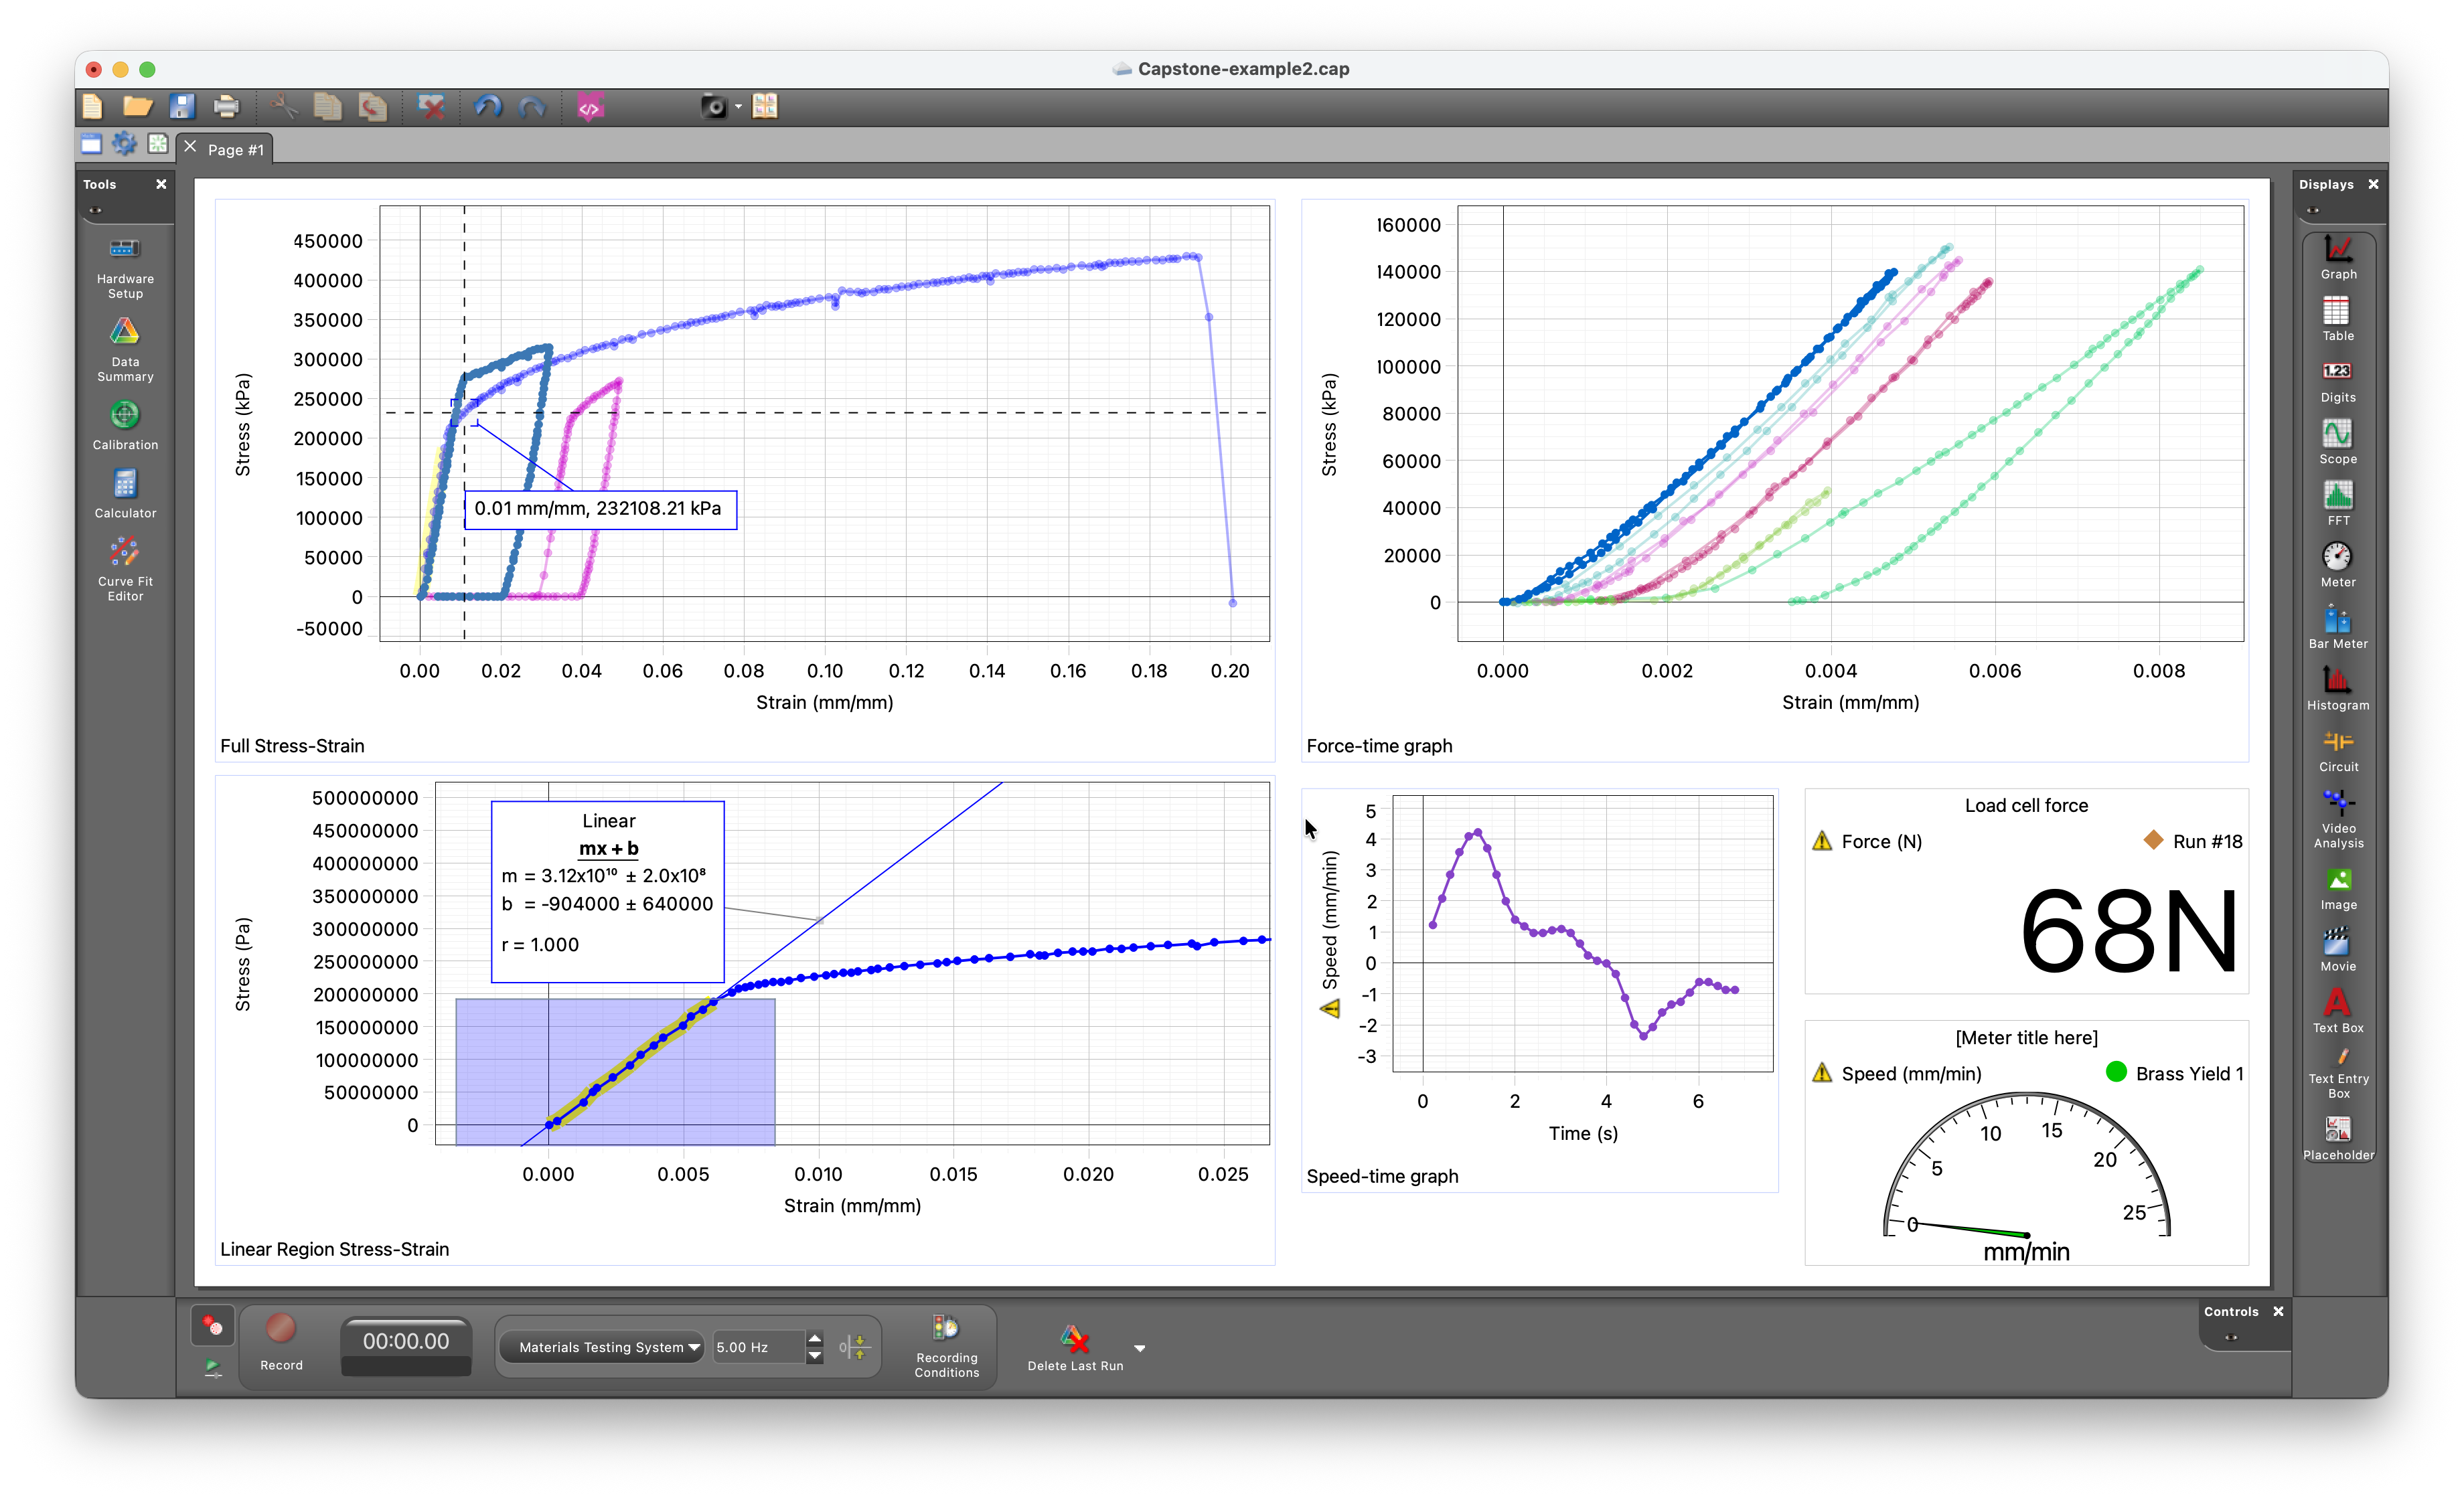
PASCO Capstone setup
For this lab, download the Capstone file located here. Save a copy of it, then delete all the data associated with it to replace it with your own data. You are encouraged to use a setup such as the following.
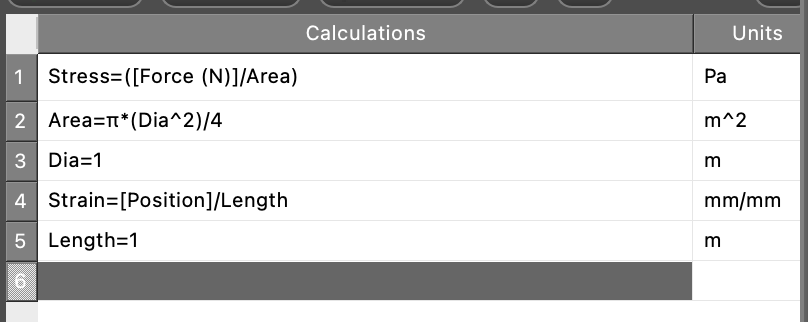
Prepare ‘Calculated Values’
Select the Calculator tab on the left panel of PASCO Capstone. This will be used to make ‘calculated values’, which are an additional feature of the software that allows you to visualize quantities that have been computed from the ones that the materials testing machine reports.
Note
You must put in correct values for the diameter and length of your sample.
Set up axes
You are encouraged to set up two sets of stress-strain axes.
On one set of axes, you should set up the horizontal axis to be primarily in the linear range of strains. This allows you to use the ‘Highlight range of points’ button  and the ‘fit’ button
 to determine an approximate value for the Young’s Modulus, taking care to only include points in the linear range in your calculation.
On the other set of axes, your goal should be to capture the entire stress-strain curve with no zooming or panning required.
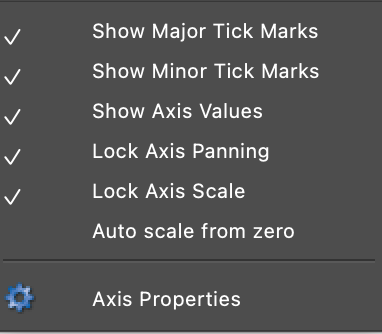
To help achieve this objectives, you should manipulate the axes as needed. You can also right-click each axis to make use of the following menu:
Loading at the right speed
The standard procedure for tensile testing engineering specimens involves a constantly-applied rate of displacement. Since this is not possible with the current apparatus, you must make an effort to apply displacements as slowly as you can, within the time constraints of the lab.
Note
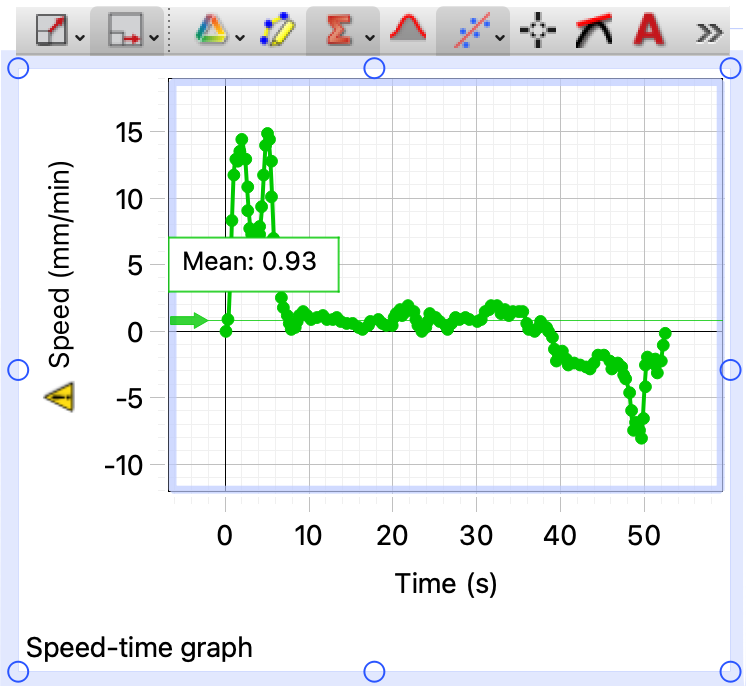
It is suggested that you use an average speed of 0.5 to 1.0 millimeter per minute. For every load cycle in this lab, you must record and later report the average speed at which loading / unloading was carried out.
☞ Second specimen
The second specimen of each sample must be loaded in a particular manner, not directly to failure.
☞ Take measurements
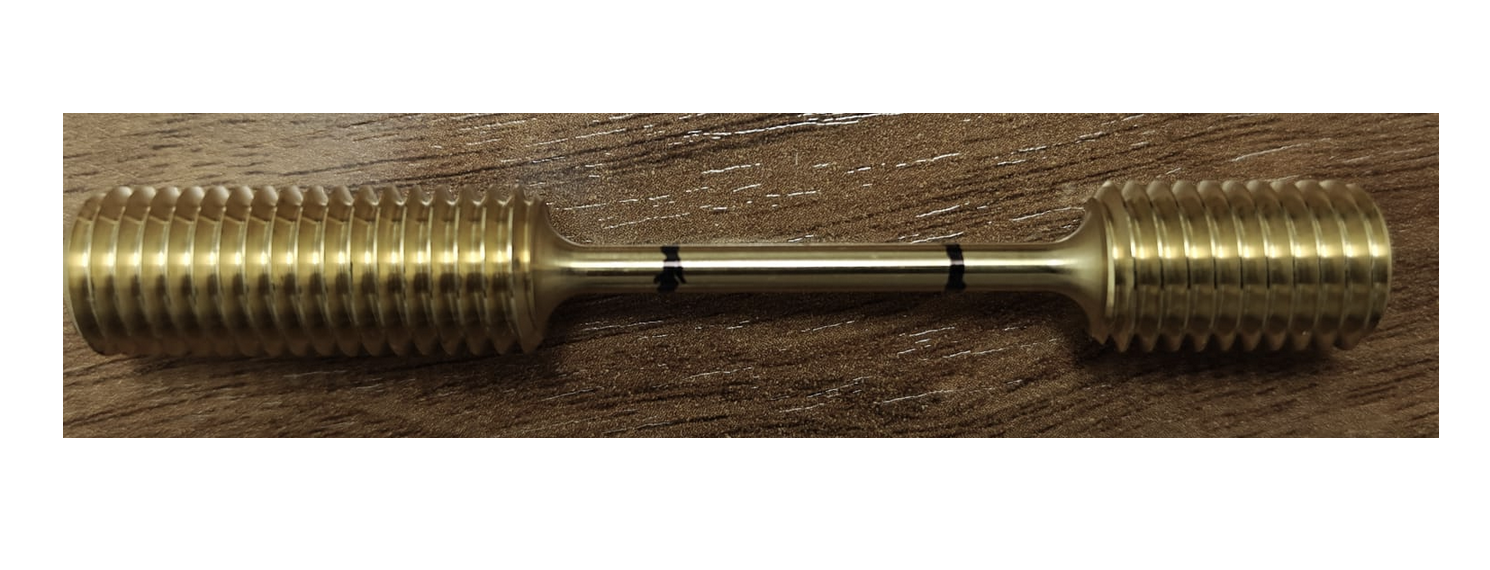
Place two marks on the second specimen using a Sharpie as shown below. Record the length of the portion of the specimen enclosed between the two marks using the calipers, taking care to use the appropriate precision in reporting the value that you find.
☞ Loading in the linear region
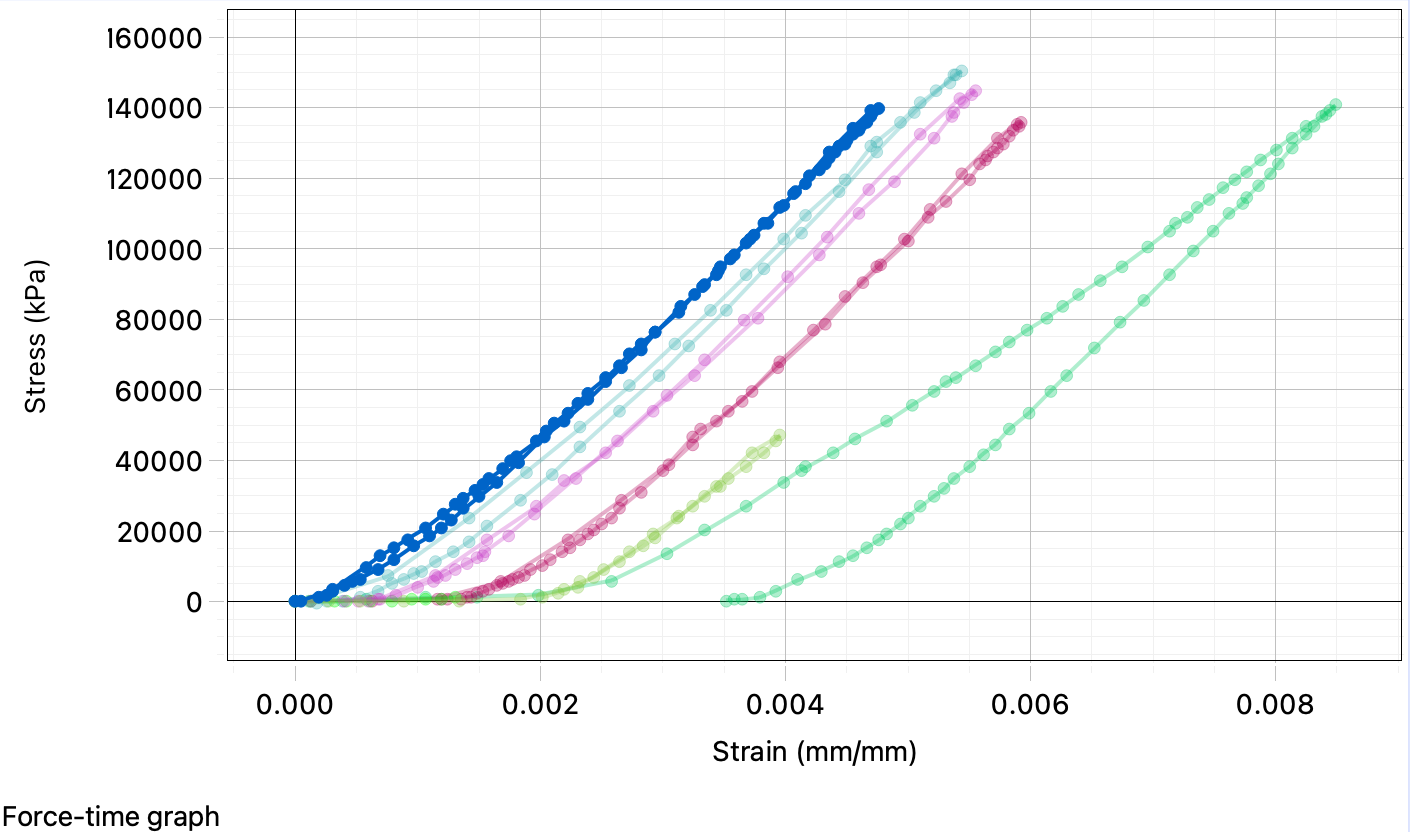
Carry out between 5 and 10 cycles of loading the sample from its completely unstressed state to some point before the yield point, i.e., only in the elastic region.
Warning
Do not let the material yield at this stage! You don’t have extra samples.
Your graphs should look approximately like the following.
Warning
Your graphs should all start from the origin if possible. Thus, some of the data runs above are examples of bad data collection. To start from the origin, you have to ensure that you have turned the crank up to the point of almost loading the specimen before clicking record.
If you don’t get this quite right, you can post-process later.
☞ Loading in the nonlinear region
Carry out between 5 and 10 cycles of loading + unloading in the plastic region of the stress-strain curve. As far as possible, try to do this without breaking the sample until the last cycle.
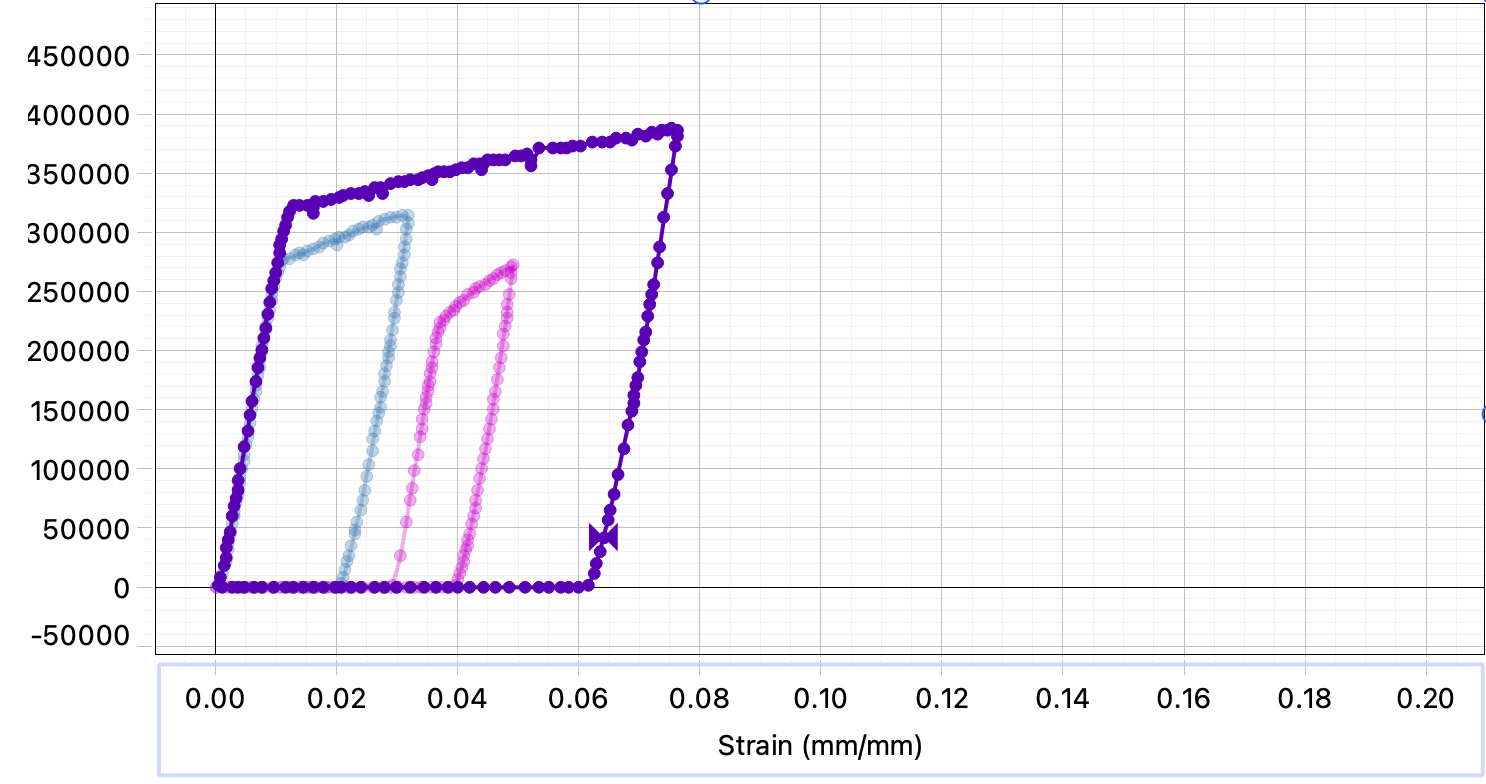
A ‘cycle of loading + unloading in the plastic region’ means that you should increase the displacement up to a certain value (i.e., load the sample) and then turn the crank in the reverse direction (i.e., unload the sample), all at a slow speed. You should ensure that you load the specimen past the point of yielding and also that you unload the specimen until it feels no more stress.
After each cycle, you should inspect the specimen and measure:
- the smallest cross-sectional area anywhere on the specimen.
- the length of the specimen between the two marks that you placed.
Note
Each loading cycle must apply a greater maximum strain than the last one. However, you should be careful to make small increments so as not to break the sample.
You can see an example of three cycles of loading followed by unloading in the following graph.
☞ Young’s Modulus
Use MATLAB’s curve-fitting toolbox to estimate the slope of the straight-line portion of the stress-strain graph.
Determine the value of Young’s Modulus for each sample using all of your experiments. How confident are you about this value? Use a box chart, sample below, to communicate your results. A box chart can be made in MATLAB using the boxchart function, which you should look up on the MATLAB documentation page.
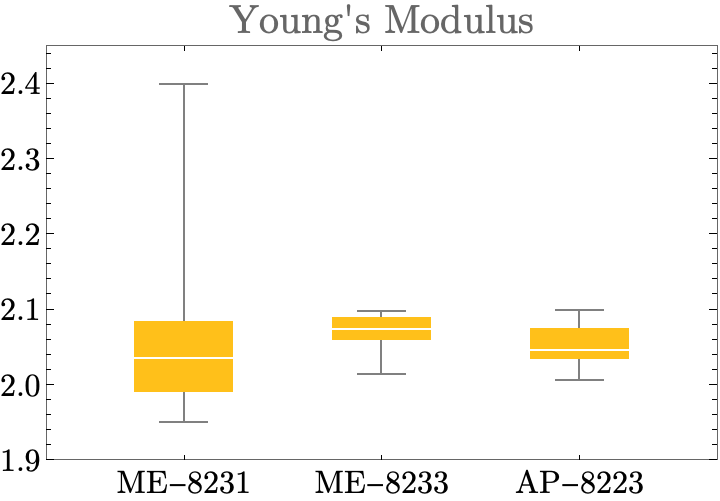
Figure 4: Sample Box Chart