Lab 1: Materials Testing 101
Introduction
In this lab, you will get acquainted with the Materials Testing Machine, often referred to as a ‘tabletop UTM’ (Universal Testing Machine). This is tabletop version of the equipment that you used during your truss lab in E6.
It is recommended that you go through the entirety of this document before you begin working on the lab. Some sections are intended for informational purposes and to help you get acquainted with the equipment. Your deliverables for this lab are under those sections marked with the pointed hand symbol (☞).
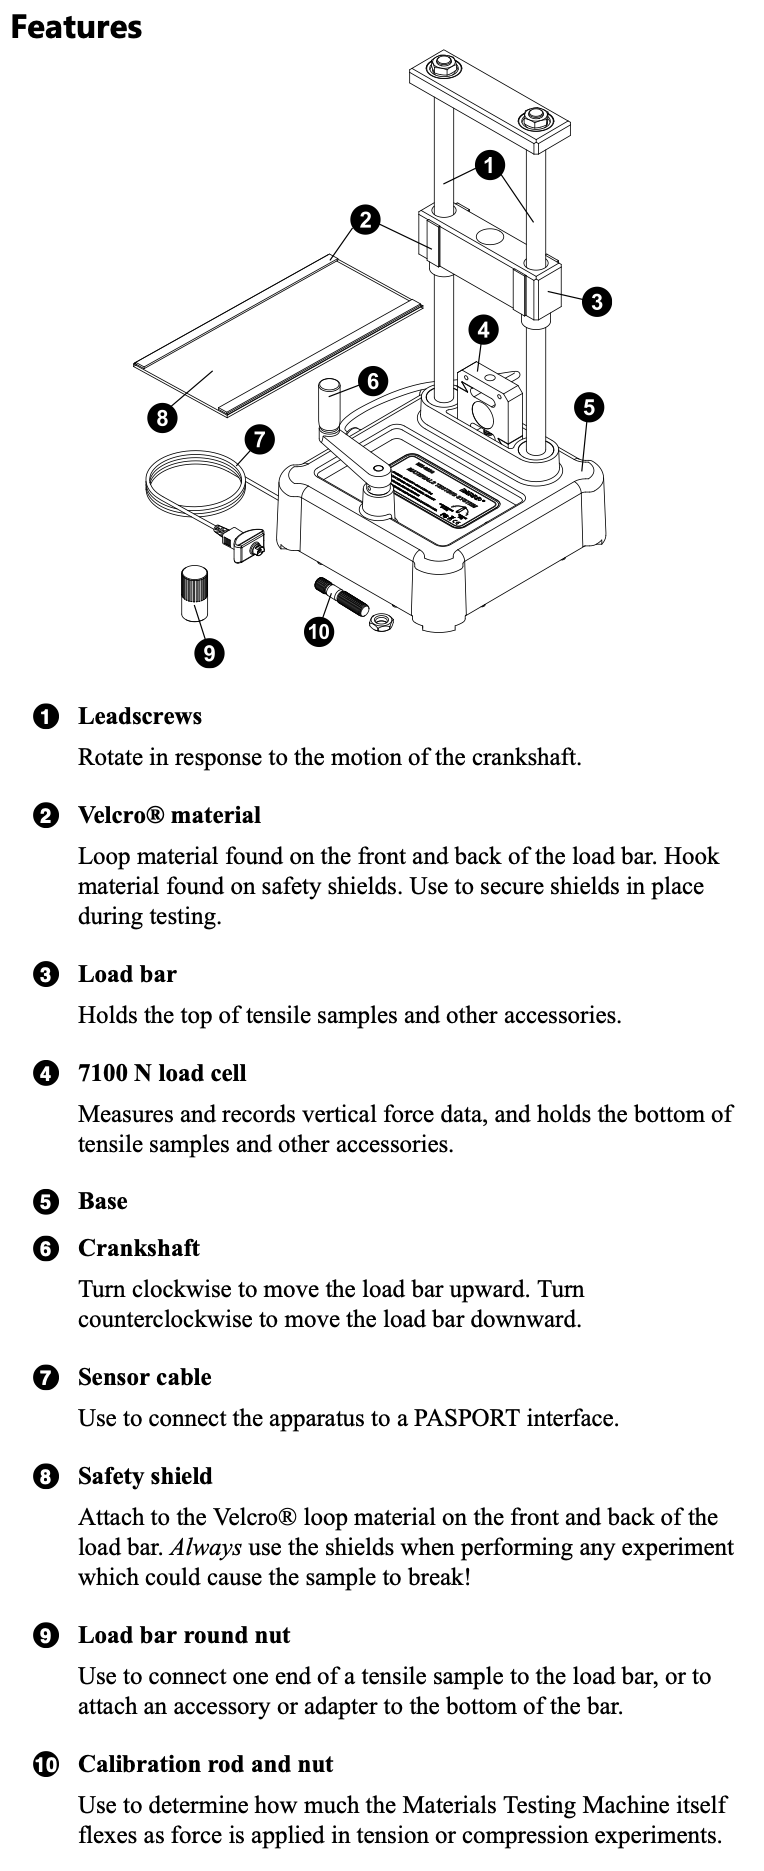
The Materials Testing Machine (ME-8236)
Do not exceed 7,000 Newtons of force on the machine. This will damage the load cell permanently.
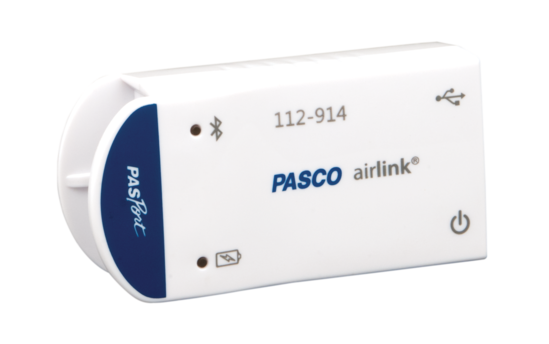
The PASCO airlink is a communication device that allows the device to communicate its sensors’ data to a computer. The airlink can use bluetooth or USB; we will use USB.
PASCO Capstone Software
Getting started
Log into the workstation and start up PASCO Capstone software.
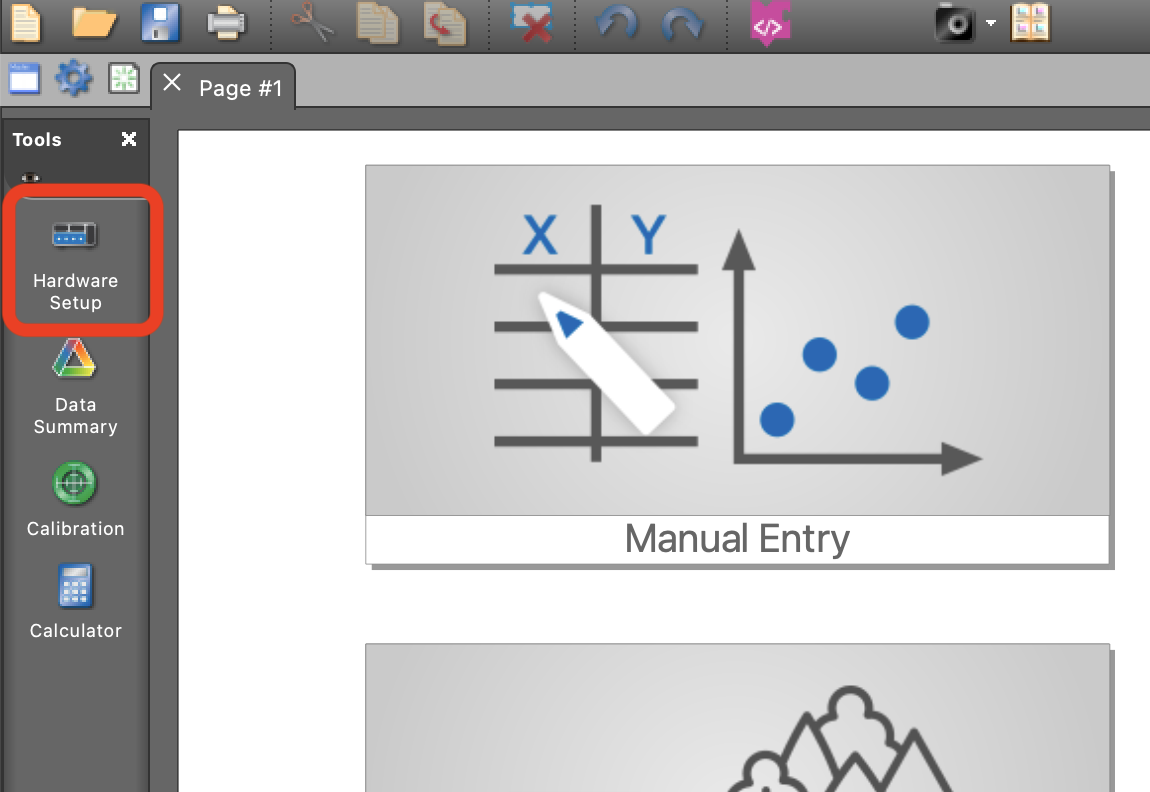
Connect the PASCO airlink via USB to the workstation. Ensure that the device is connected by clicking the ‘Hardware Setup’ tab.
- You should see PASCO airlink in the menu, which is the portal through which the computer talks to the device. Click the settings button.
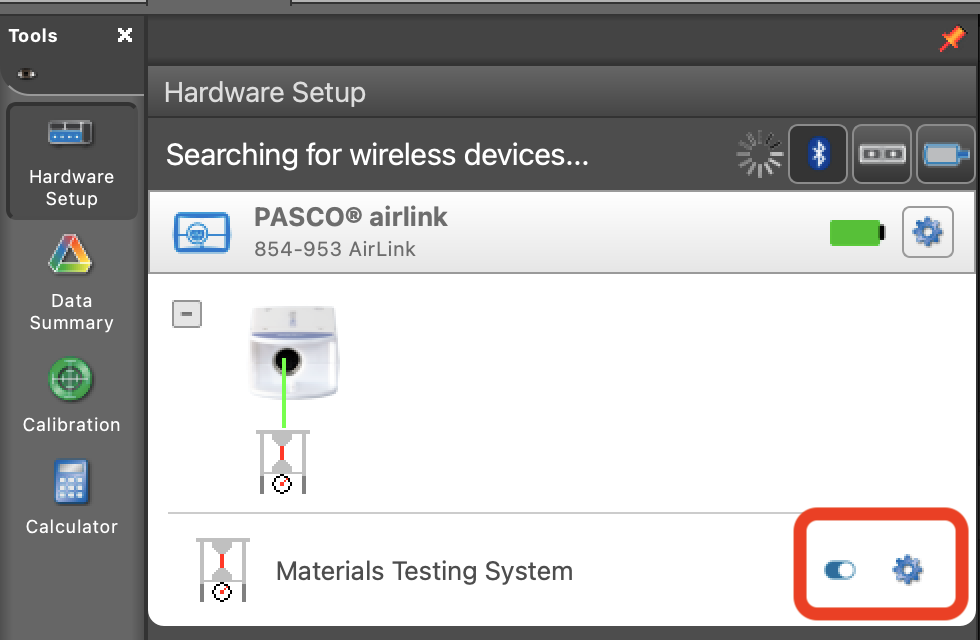
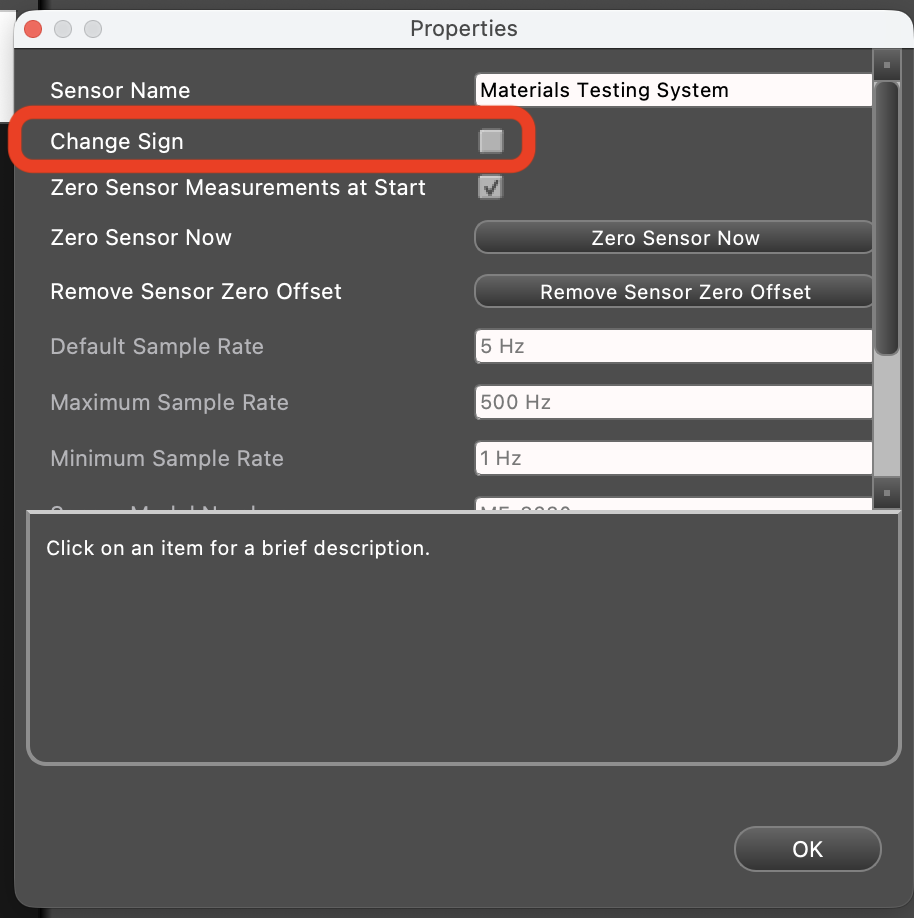
- Note the ‘Change sign’ button, which does what you would expect. You may want to use this button based on how you wish your graphs to look. If you forget, you can always post-prcess to fix the signs later. Leave all other values at their defaults, but feel free to change other settings if you know what you’re doing.
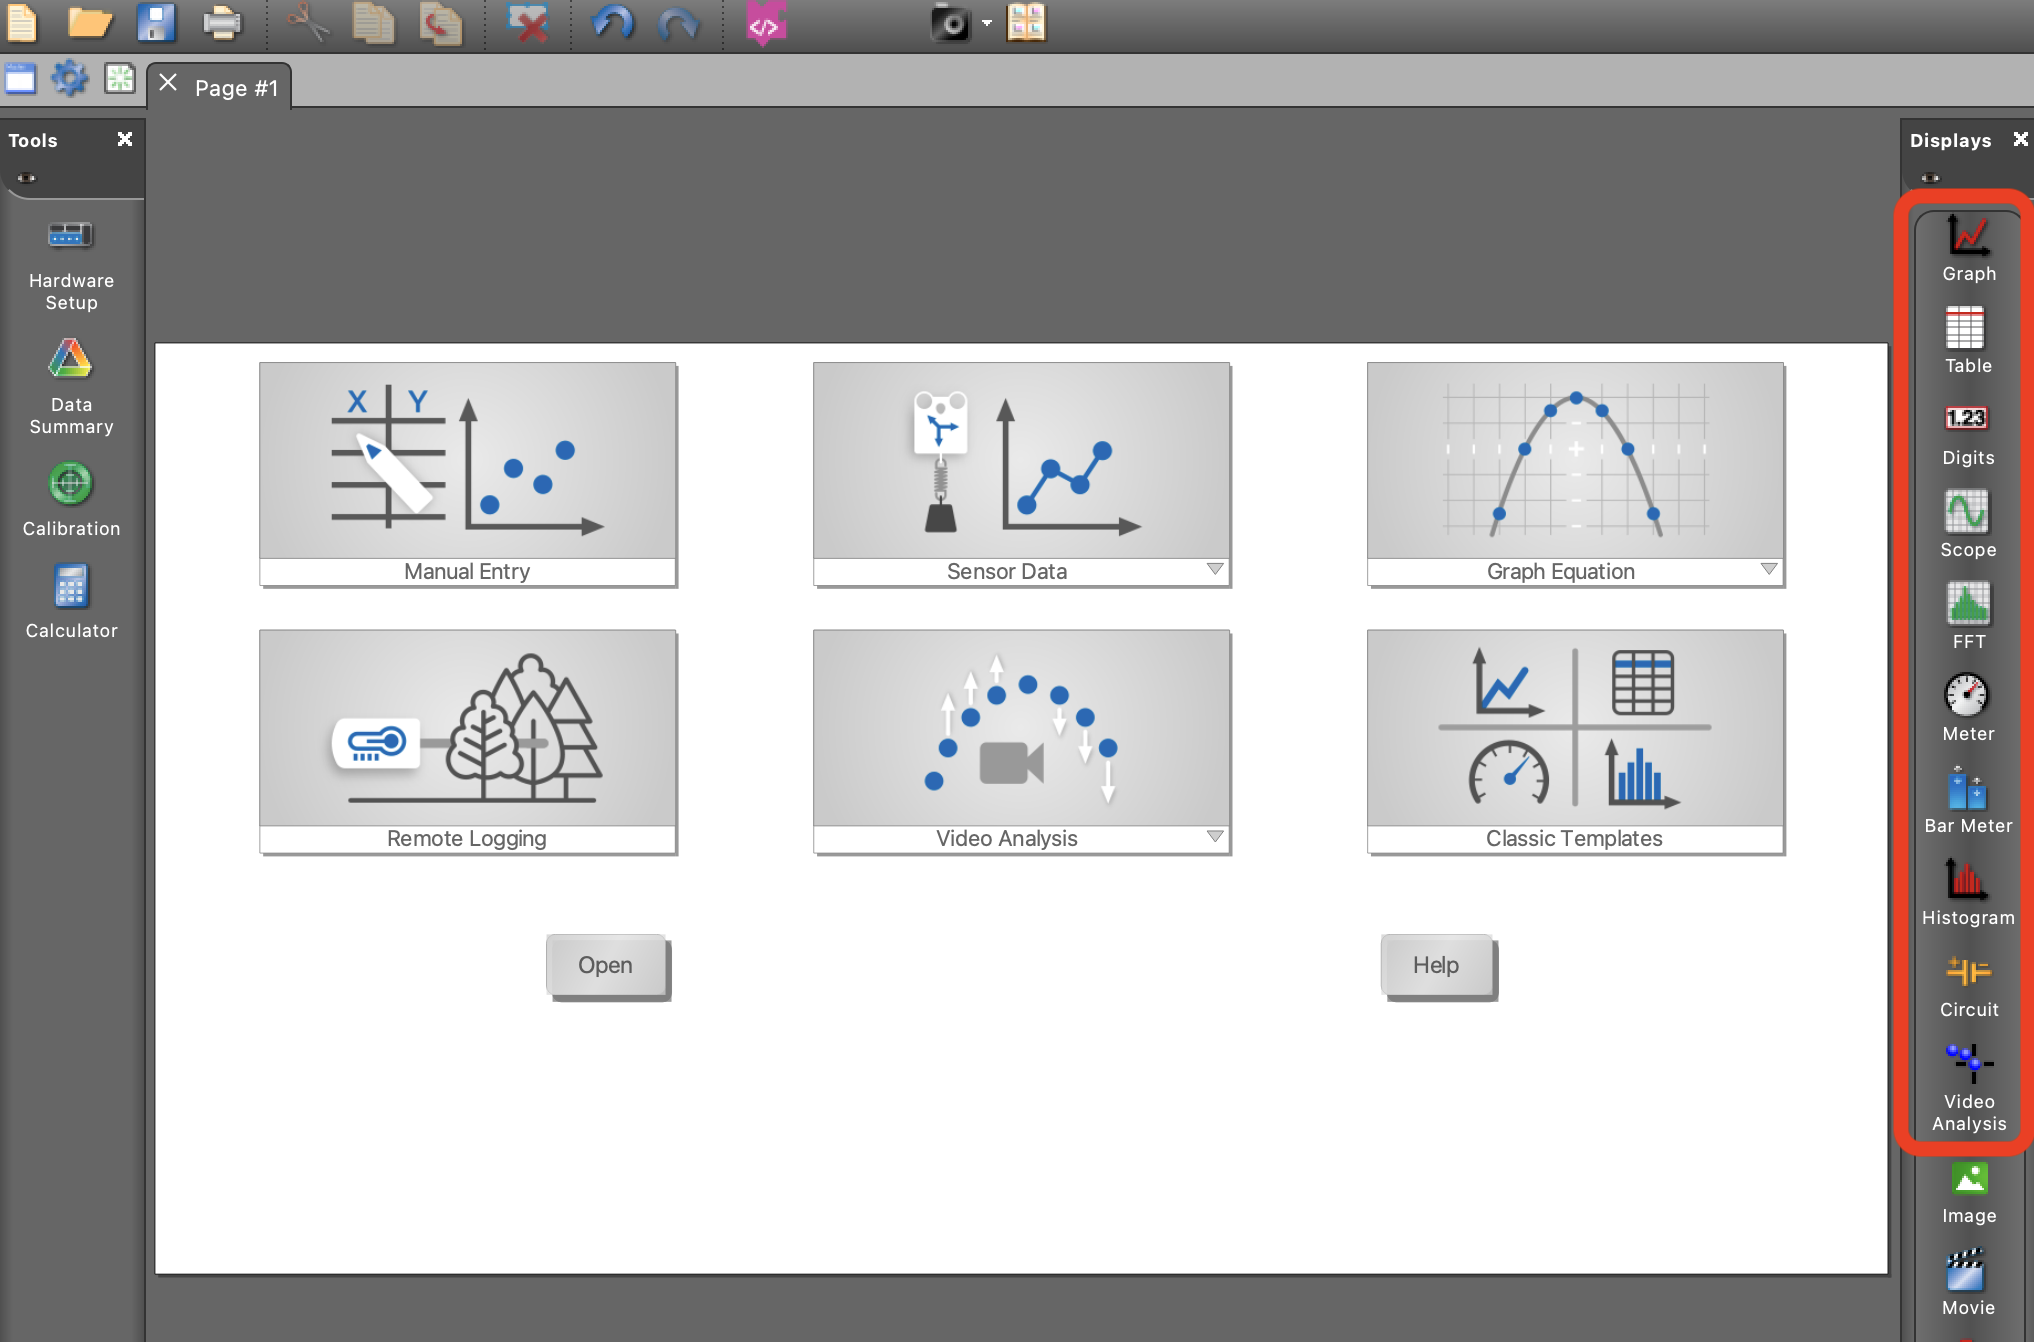
- Set up a display by dragging and dropping elements from the sidebar to the right.
- To start, replicate the following setup as closely as possible. Note the quantities (speed, force, time, etc.) that have been chosen on each axis, column table, or display.
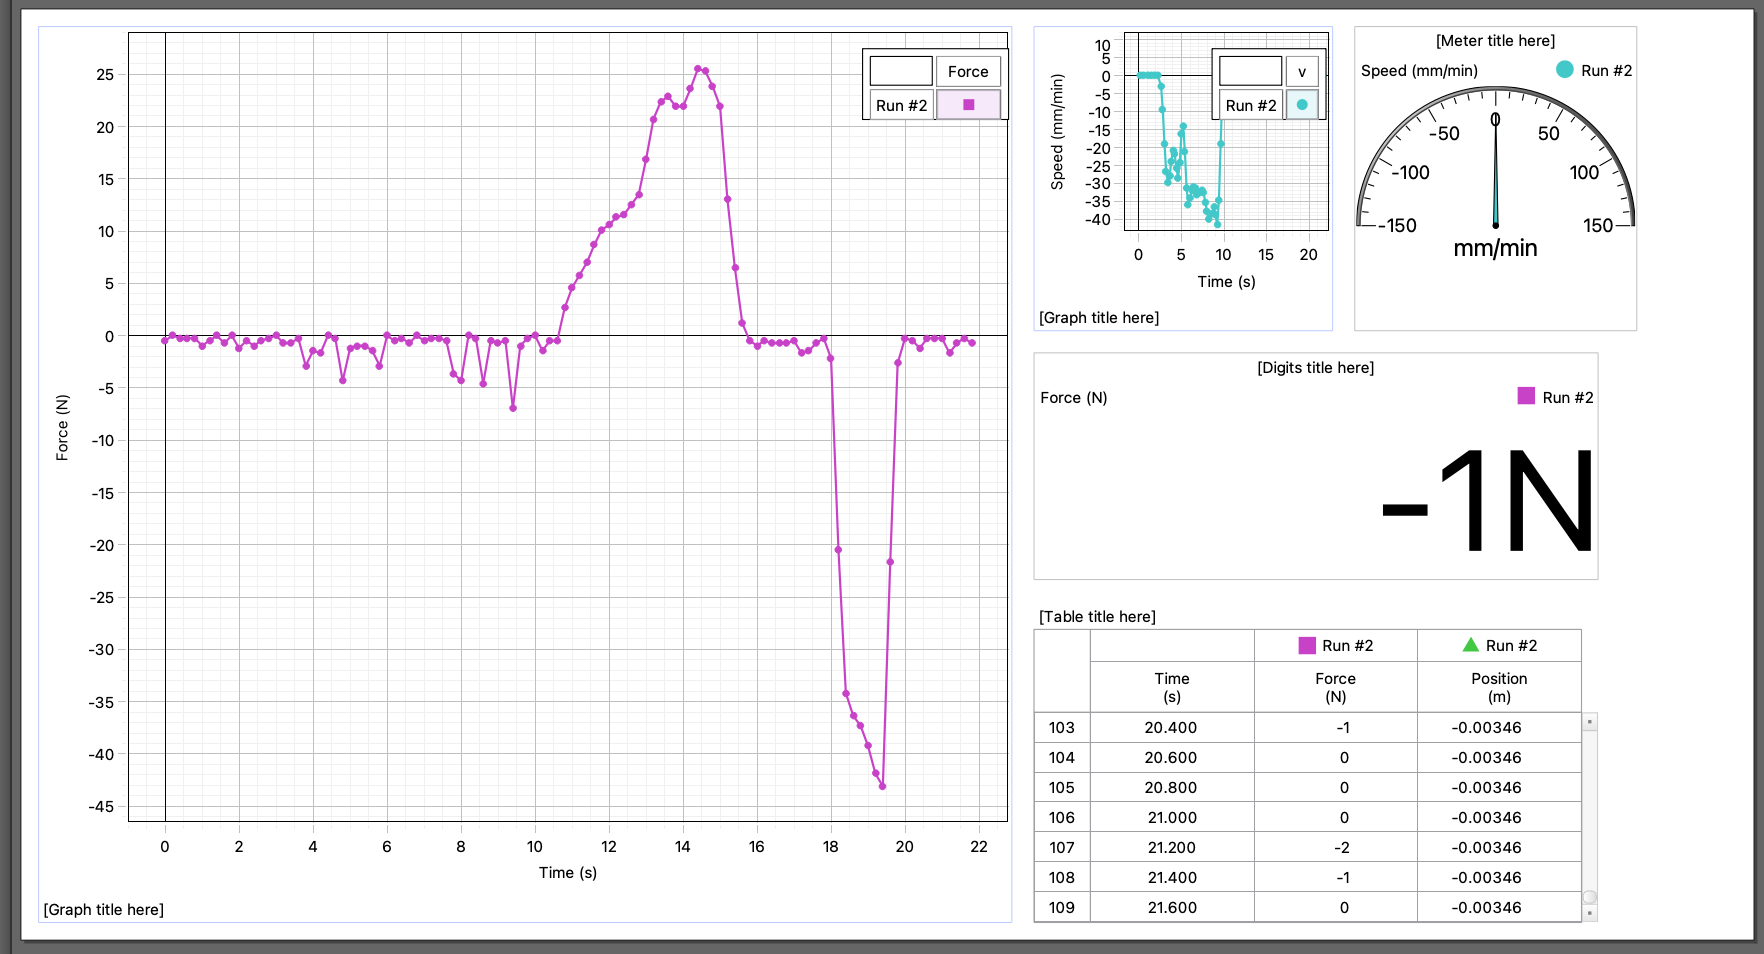
- Click Record and move the load bar up and down a few centimeters. Try pressing down or pulling up on the load cell, and adjust the sign based on step 4 if needed.

Export Data
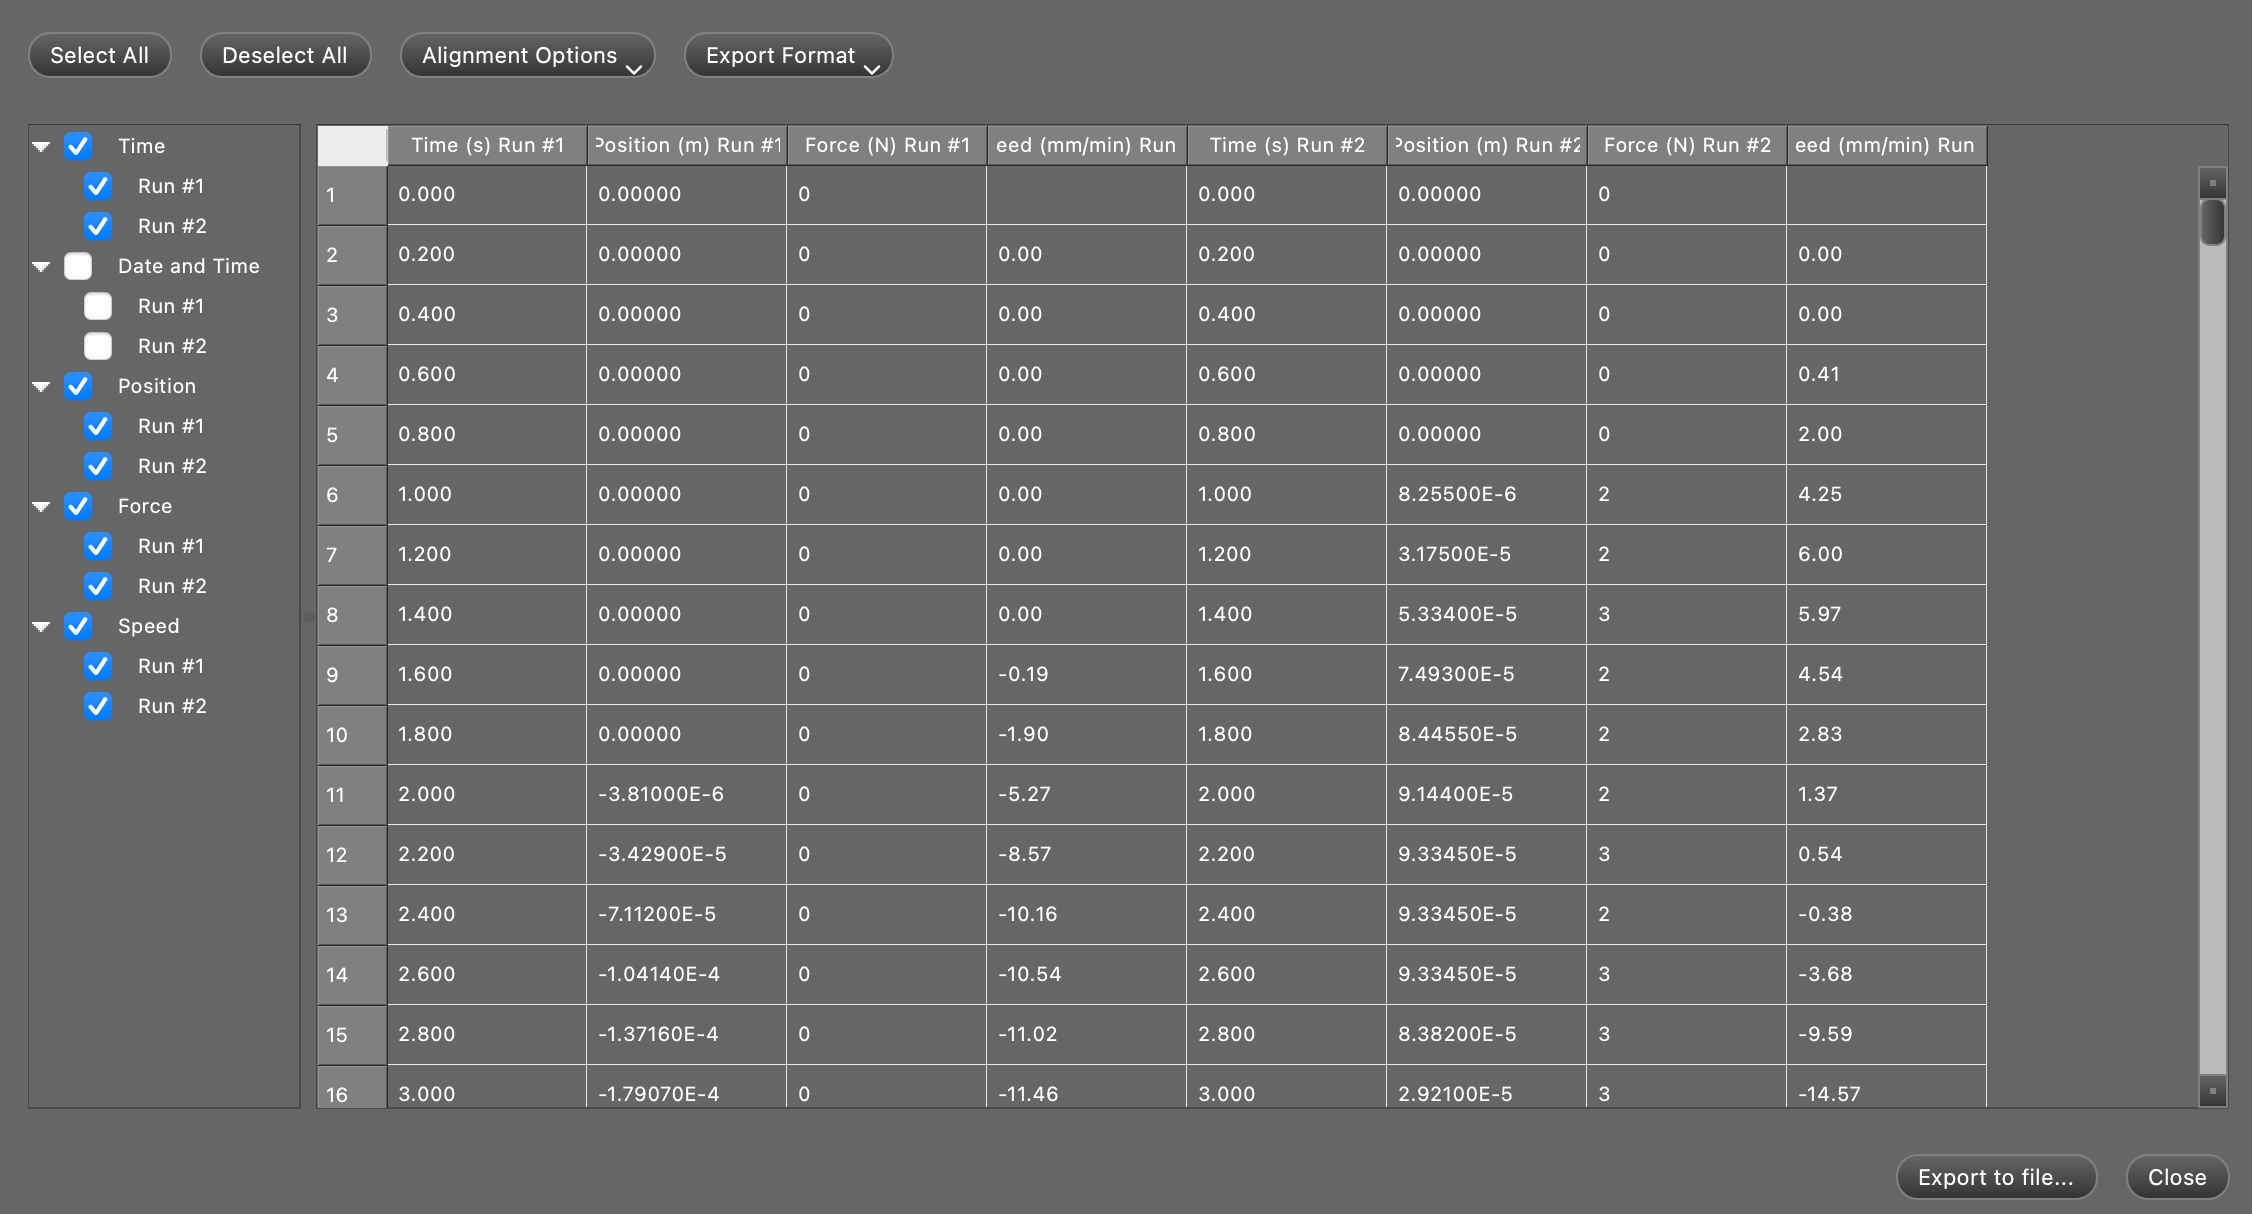
You can export data from an experiment by clicking File > Export Data. Select the columns you wish to export and Capstone will save a .csv file in a location of your choosing.
Name ‘run’
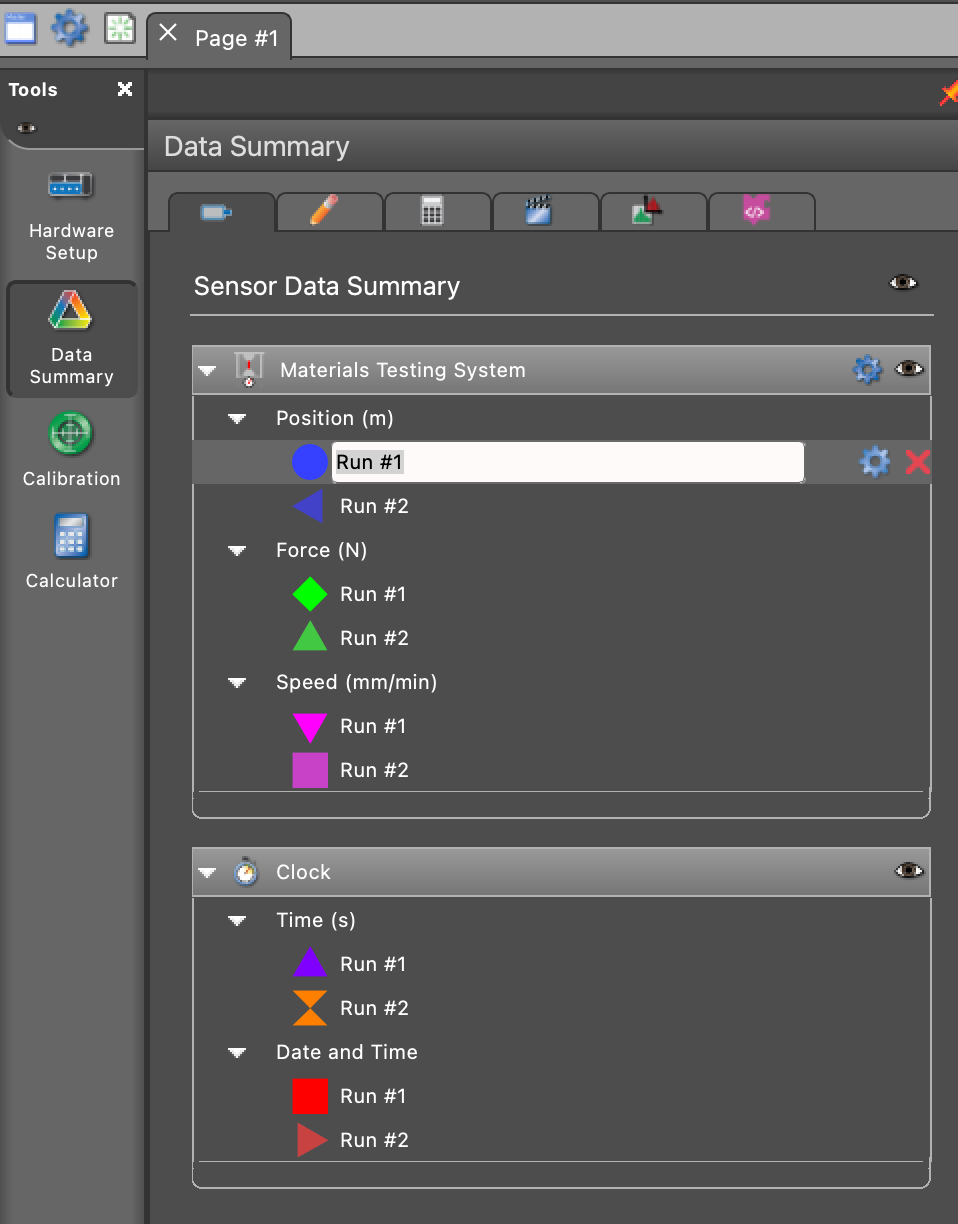
A ‘run’ is one instance of recording data. If you start recording and then stop recording, the data during this window will be stored in a ‘run’, and Capstone will name runs ‘1’, ‘2’, etc. You can rename these in the Data Summary tab as shown here.
Equipment
Samples
You will test four types of samples in this lab. Collect these samples in one place.
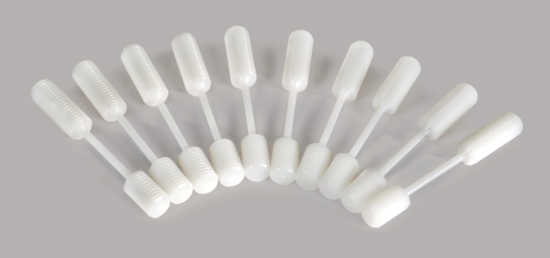
- 3 x Polyethylene tensile sample (ME 8235).
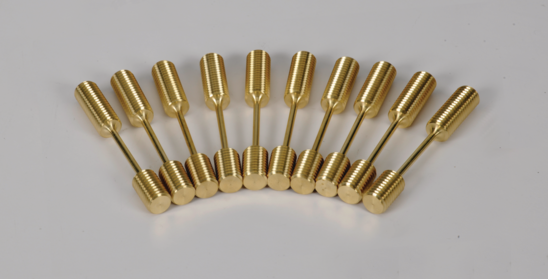
- 1 x Brass tensile sample (ME 8232)
- 4 x Plastic coupon (AP 8222), one of each color (start with black).
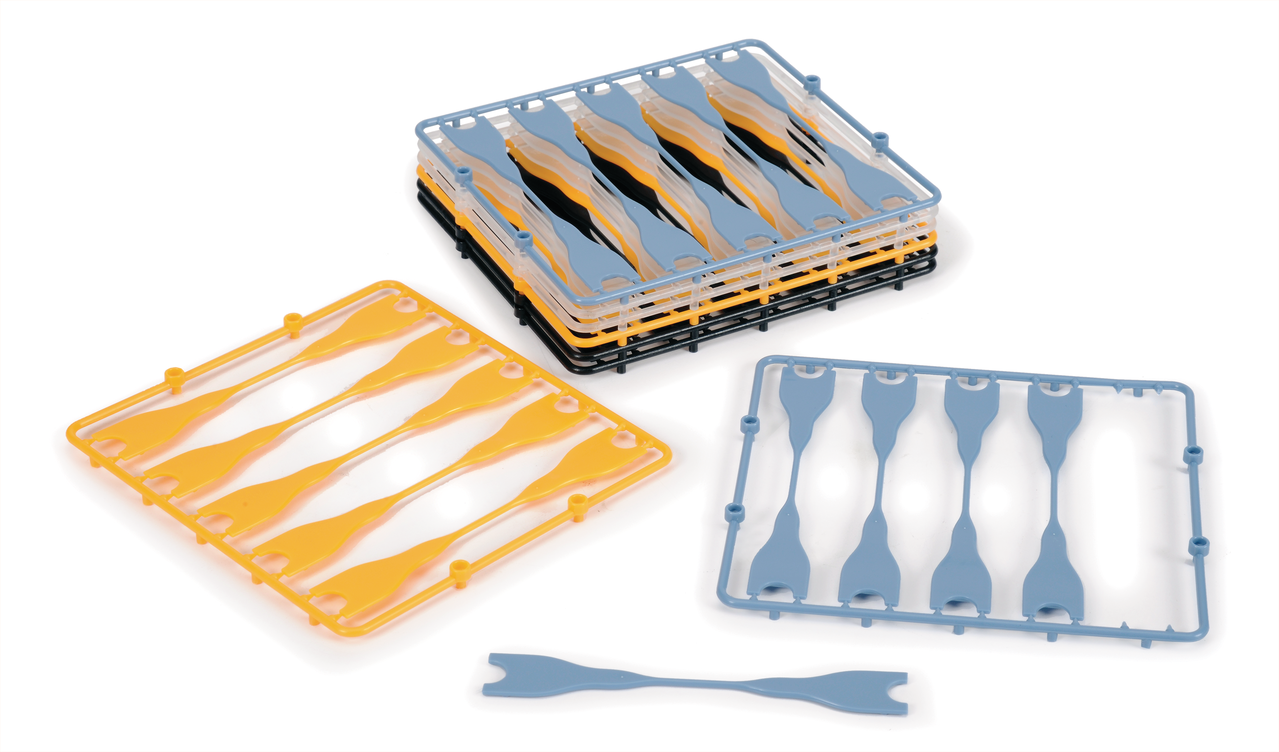
- 4 x Thin I-beams (ME 7012), two of each size.
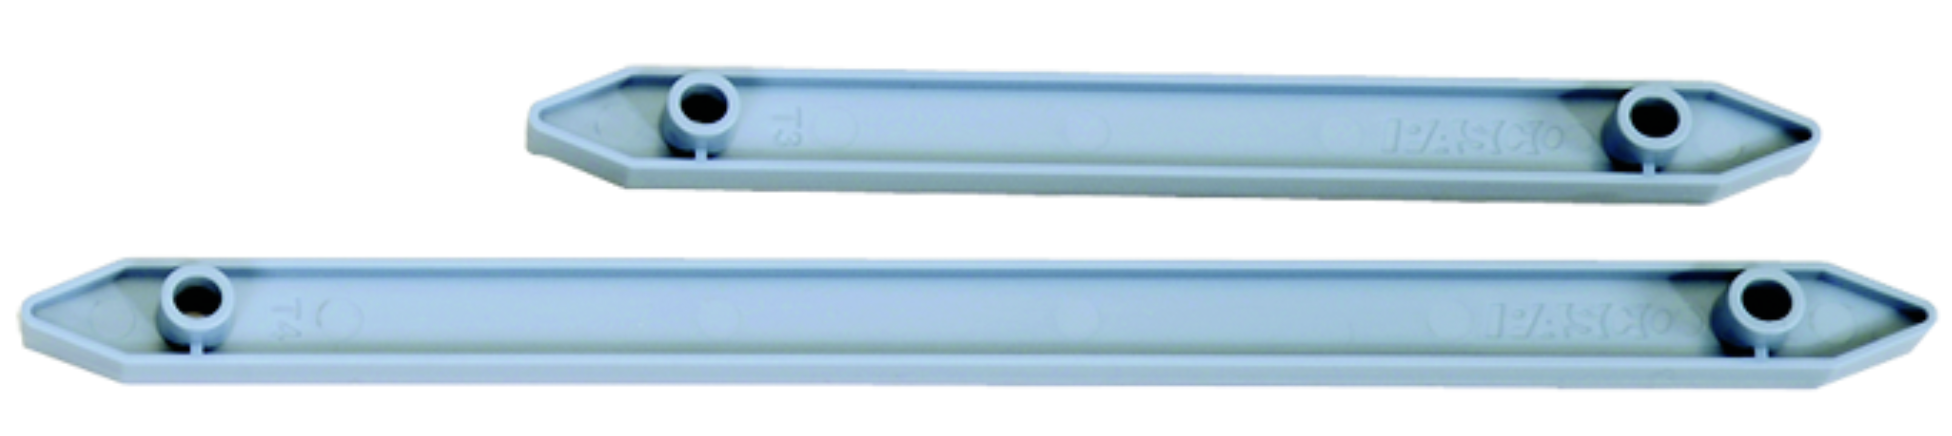
Attachments
You will use the following attachments:
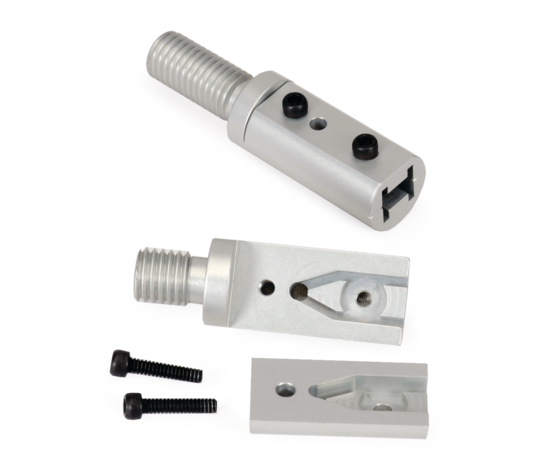
- Coupon Adapter (ME-8238) for use with plastic coupons.
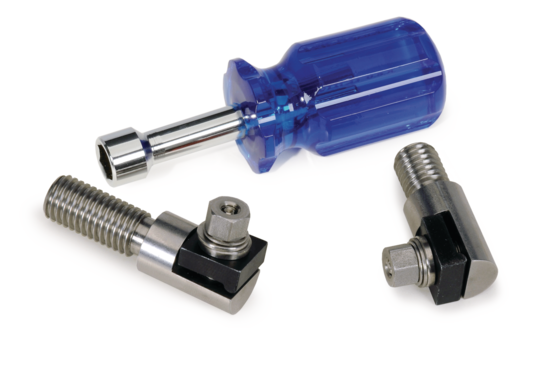
- Beam Adapter (ME-8242) for use with I-beams.
To summarize:
| Sample Type | Attachment |
|---|---|
| ME-8235 | None |
| ME-8232 | None |
| AP-8222 | ME-8238 |
| ME-7012 | ME-8242 |
Other materials
- You will need to take photographs of your sample before and after testing, including close-ups. A cell phone camera is sufficient for this.
☞ Calibration
Calibration helps account for the (very small) flexibility that the Materials Testing Machine has. It can be carried out by applying force (tension or compression) to a completely rigid sample, such that any changes in the position observed when testing this sample are actually due to the non-rigidity of our testing apparatus.
Capstone can subtract this displacement from all of your future measurements. To do so, you will need to collect tension or compression data — not both — and fit a polynomial curve to it. This polynomial should pass through the origin (i.e., when there’s no force, there should be no displacement). It is recommended that you use a polynomial of order 1 or 2.
Follow the instructions on pages 3-4 of the ME-8236 manual to create a calibration for your machine. You should perform your calibrations in tension and you should use a maximum force of about 1,000 Newtons.
Save the resulting calibration onto the device using one of your names; Capstone will automatically apply this.
Note down the polynomial curve fit for your report.
☞ Measure Samples
Determine the cross-sectional area of each of the four types of samples in square meters using a pair of calipers.
| Sample Type | Area |
|---|---|
| ME-8235 | |
| ME-8232 | |
| AP-8222 | |
| ME-7012 |
☞ Break Samples
Break each sample from the list above, if possible, by slowly applying tension using the appropriate attachments. The relevant manuals from the sidebar will help you affix any attachments to the materials testing machine.
The goal is to collect information about how different materials fail. For the samples where you have more than one, repeat experiments give you the opportunity to vary the rate at which you apply force to the sample. Try out different speeds and choose ones that you can comfortably apply.
Some general principles:
- Try to maintain a constant speed of rotation of the crank when applicable.
- Never let the load cell reach higher than 7,000 Newtons in tension or compression.
- Click “Record” before you start applying force! It’s okay to have some delay before and after data collection; zero values can always be ignored or removed later.
- Use the protective shield.
☞ Lab Report / Memo
You will prepare a memo reporting on your experiments from the perspective of a materials testing laboratory that has been sent these samples to determine their strength. Your customers are interested in knowing how much force (in Newtons) and stress (in Pascals / Megapascals) these samples can undergo, in tension, before they become unusable and/or break. Assume that your reader is an engineer who is familiar with the ME-8236 testing machine.
Your memo should be in English, structured as a letter, and written in a style appropriate for communicating scientific results. If you use equations, make sure they are typeset appropriately. There are no strict length requirements.
All figures must be generated in MATLAB from exported csv files. Pay careful attention to the figures, especially:
- font sizes
- line thickness
- legends
- axes’ limits and labels
- units
List of figures
- A graph showing the calibration that you used. This should consist of position on the horizontal axis, force on the vertical axis, and should superimpose the polynomial found by Capstone’s curve-fitting algorithm.
In real life, you will probably not include your calibration in such a memo, but you should attempt to incorporate the calibration into your narrative. Explain in words what the calibration says about the ME-8236 system.
- A table with 12 entries, one for each sample that you tested. It should fit on one page and should have the following columns:
| Sample Type | Force at failure | Stress at failure | Necking |
|---|---|---|---|
| ME-8235 | x | x | Yes/No |
A set of before-and-after images, including a close-up of the location where failure occurred. Do this for any four out of the 12 experiments you conducted.
Four graphs showing strain on the horizontal axis and stress on the vertical axis, incorporating data from all twelve experiments. Use the
subplotsfeature of MATLAB to generate a 2x2 arrangement of the four required graphs. One set of axes will be for ME-8235, one for ME-8232, one for AP-8222, and one for ME-7012. Repeat experiments within the same sample type should be overlaid on the same set of axes, and labeled using different line types, legends, etc.
Use the starting length and the starting cross-sectional area as the relevant reference values for strain and stress. Make a decision about which lengths and which areas are appropriate for each sample.
- A comparison with published values for AP-8222. Compare the stress at which you found the AP-8222 samples to break with the relevant values found under ‘Sample Specifications’ on the website.