Lab 5: Compression and Buckling
ENGR 059 • Fall 2026 • Swarthmore Engineering
1 Theory
The theory of beam buckling is covered in Hibbeler, Mechanics of Materials in Chapter 13, and in Beer & Johnston, Mechanics of Materials in Chapter 10.1
Materials that show elastic behavior in tension also tend to show elastic behavior in compression. In compression, an additional possible mode of failure — which is impossible in tension loading — is buckling.
Leonhard Euler derived a formula for the critical compressive load \(P_{\text{cr}}\) at which a column will buckle. This crticial load is
\[P_{\text{cr}} = \frac{\pi^2 E I}{L_{e}^2}, \tag{1}\]
where \(E\) is the Young’s Modulus, \(I\) is the smaller of the two moments of inertia \(I_x\) and \(I_y\) of the cross section about its respective neutral axes, and \(L_e\) is the effective length of the column. The effective length is related to the true length by a multiplicative factor, i.e., \[L_e = K L \tag{2}\] where \(K\) depends on the way the load is applied.
- If both ends of the column are pin joints, \(K=1\).
- If one end of the column is fixed and the other is free, \(K=2\).
- If one end is fixed and the other is pinned, \(K=0.7\)
- If both ends are fixed, \(K=0.5\).
Using the relation between stress, force and area for uniaxial loading, it is possible to derive a formula for the critical normal stress at which buckling occurs, i.e.,
\[\sigma_{\text{cr}} \equiv \left(\frac{P_{\text{cr}}}{A}\right) = \frac{\pi^2 E I}{L_{e}^2} \div A = \frac{\pi^2 E \overbrace{({A} r^2)}^{I}}{L_e^2 \cdot {A}} = \frac{\pi^2 E}{(L_e/r)^2}, \tag{3}\]
where we have used the fact that \[r \equiv \sqrt{\frac{I}{A}}\] is the radius of gyration of the cross-section.
Note that \(r\) here is not the actual radius; it is a radius of gyration.
The ratio \(L_e/r\) is known as the slenderness ratio.
Buckling can only occur if \[\sigma_{\text{cr}} \leq \sigma_{Y}, \tag{4}\] where \(\sigma_Y\) is the yield stress and \(\sigma_{\text{cr}}\), given by Equation 3, is the stress corresponding to the Euler load. This is a necessary, but sufficient, condition.
2 Materials and Methods
2.1 Samples
| Sample | Material | Image | PASCO Number |
|---|---|---|---|
| 1 (x3) | Polyethylene |  |
ME-8248 |
| 2 (x3) | ABS |  |
ME-7012 |
| 3 (x3) | ABS |  |
ME-7012 |
| 4 (x3) | ABS |  |
ME-6987 |
| 5 (x3) | ABS |  |
ME-6987 |
| 6 (x3) | ABS |  |
ME-6987 |
| 7 (x3) | Annealed Steel |  |
ME-8233 |
2.2 Material Properties
For metals, compressive material properties are not very different from tensile ones. However, for other materials such as plastics, the numbers can be significantly different.
The values below represent estimates only.
| Material | Compressive Yield Strength | Compressive Young’s Modulus |
|---|---|---|
| ABS | \(65\) MPa | \(2.5\) GPa |
| Polyethylene | \(20\) — \(80\) MPa | \(0.7\) — \(1\) GPa |
| Annealed Steel | \(345\) MPa | \(200\) GPa |
2.3 Attachments
In this lab, you will use two attachments to the PASCO Materials Testing System.
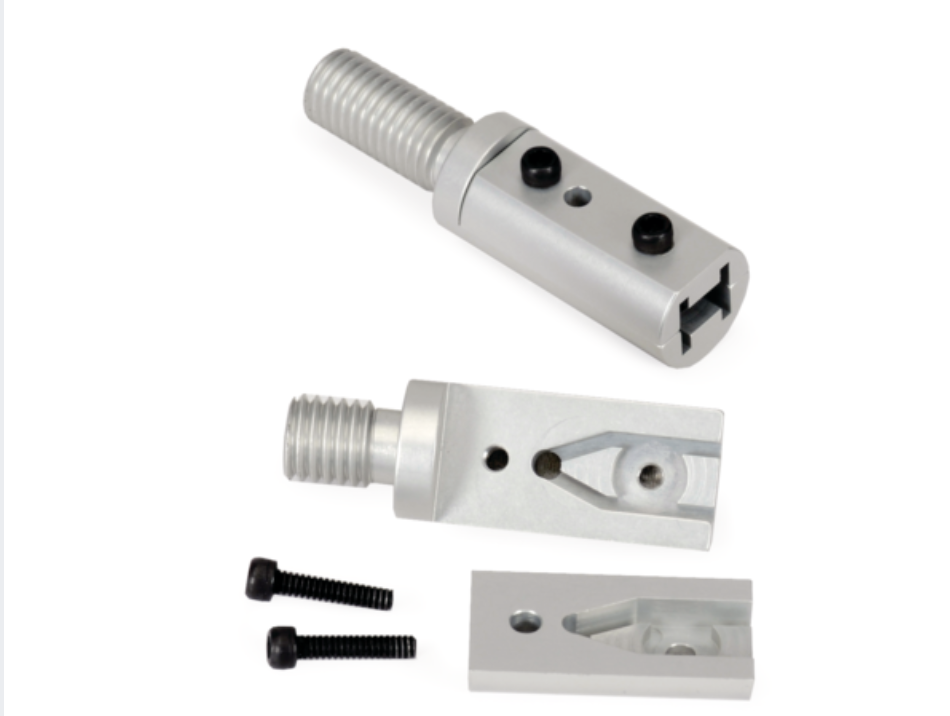
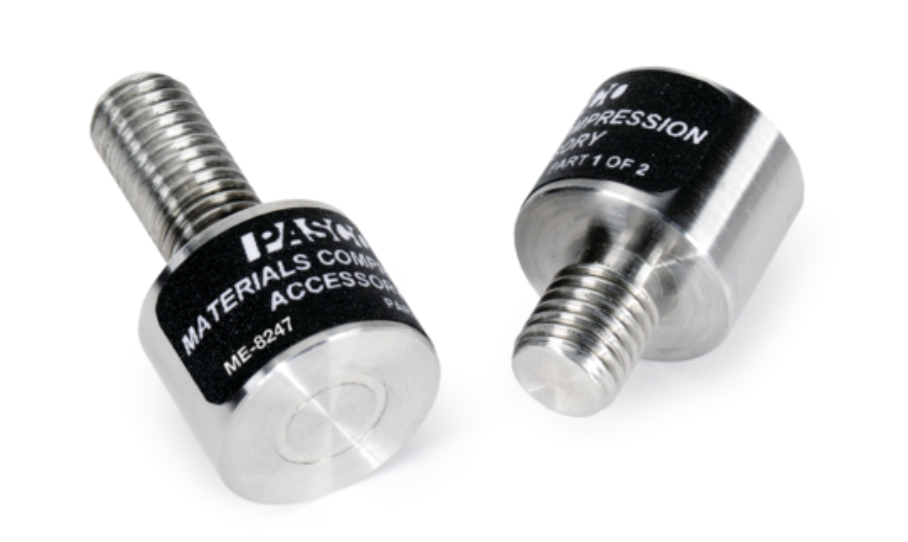
3 Tasks
3.1 Calibration
Perform compliance calibration in compression.
3.2 Procedure
Load all three specimens of all samples in Table 1 in compression to failure, i.e., until:
- the material yields, or
- the beam buckles (let it buckle significantly, for fun!), or
- the load cell’s limit of 7,000 N has been reached.
Record stress (\(P/A\)) and strain (\(\Delta l / l_0\), where \(l_0\) is the true length of the portion of the sample that is a uniform-cross section prism) using PASCO’s ‘Calculations’ feature.
Take photographs of your loaded samples before, after and (if possible) during failure to document whether buckling occurs.
You may wish to consult Section 4 to ensure that you are collecting all necessary information for the memo.
4 Memo
Write a brief memo reporting on the results of your experiment. Your report should include:
- High quality to-scale1 drawings of the cross-section of each sample. Your drawings should be made in engineering software.
- Stress-Strain diagrams for the three materials (ABS, annealed steel, and polyethylene). Combine curves where appropriate to present the information as succinctly as possible.
- Photographs documenting buckling, when applicable.
- For all samples in Table 1, report the following quantities using a table or tables.
- Length,
- Cross-sectional area,
- Second moment of area about the neutral axis, including both \(I_x\) and \(I_y\), where the \(x\) and \(y\) axes represent the two principal directions in the cross-sectional plane,
- Radius of gyration in both \(x\) and \(y\) directions,
- The predicted critial load \(P_{\text{cr}}\),
- The predicted critical stress \(\sigma_{\text{cr}}\),
- The slenderness ratio \(\displaystyle L_e/r\).
- Whether Equation 4 holds,
- Whether \(P_{\text{cr}} < 7,000 \, \mathrm{N}\)
- A brief narrative, supported with numerical evidence from your tests, about how well buckling theory predicts actually-occuring buckling in various materials and geometries.
Footnotes
Making a drawing to scale means that you should pick a certain scale (say, 1 inch on the paper represents 1/2 inch in reality; choose a scale that optimizes readability if your memo is printed.) and make all your drawings to the same scale. This allows accurate comparisons across drawings.↩︎